signal strength 1 of 5
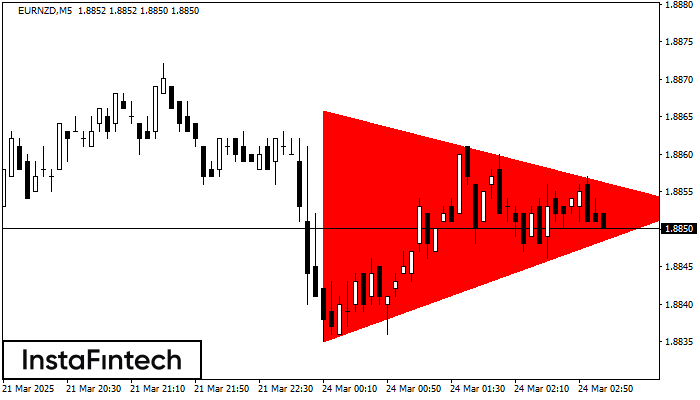
According to the chart of M5, EURNZD formed the Bearish Symmetrical Triangle pattern. Description: The lower border is 1.8835/1.8853 and upper border is 1.8866/1.8853. The pattern width is measured on the chart at -31 pips. The formation of the Bearish Symmetrical Triangle pattern evidently signals a continuation of the downward trend. In other words, if the scenario comes true and EURNZD breaches the lower border, the price could continue its move toward 1.8838.
The M5 and M15 time frames may have more false entry points.
یہ بھی دیکھیں
- All
- Double Top
- Flag
- Head and Shoulders
- Pennant
- Rectangle
- Triangle
- Triple top
- All
- #AAPL
- #AMZN
- #Bitcoin
- #EBAY
- #FB
- #GOOG
- #INTC
- #KO
- #MA
- #MCD
- #MSFT
- #NTDOY
- #PEP
- #TSLA
- #TWTR
- AUDCAD
- AUDCHF
- AUDJPY
- AUDUSD
- EURCAD
- EURCHF
- EURGBP
- EURJPY
- EURNZD
- EURRUB
- EURUSD
- GBPAUD
- GBPCHF
- GBPJPY
- GBPUSD
- GOLD
- NZDCAD
- NZDCHF
- NZDJPY
- NZDUSD
- SILVER
- USDCAD
- USDCHF
- USDJPY
- USDRUB
- All
- M5
- M15
- M30
- H1
- D1
- All
- Buy
- Sale
- All
- 1
- 2
- 3
- 4
- 5
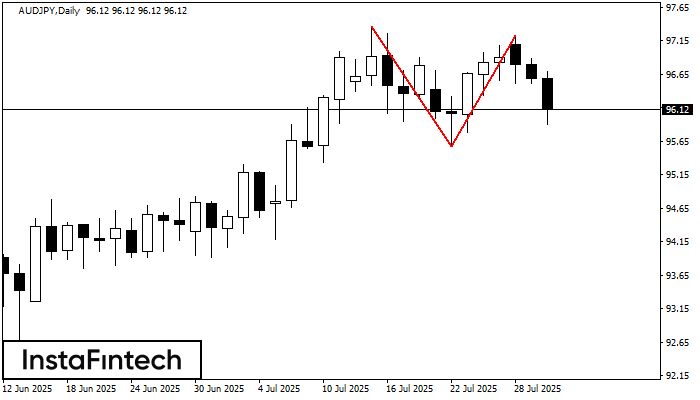
On the chart of AUDJPY D1 the Double Top reversal pattern has been formed. Characteristics: the upper boundary 97.23; the lower boundary 95.57; the width of the pattern 166 points
Open chart in a new window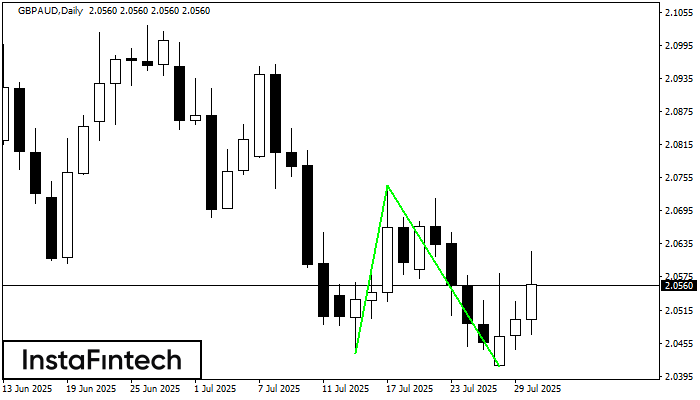
The Double Bottom pattern has been formed on GBPAUD D1. Characteristics: the support level 2.0437; the resistance level 2.0741; the width of the pattern 304 points. If the resistance level
Open chart in a new window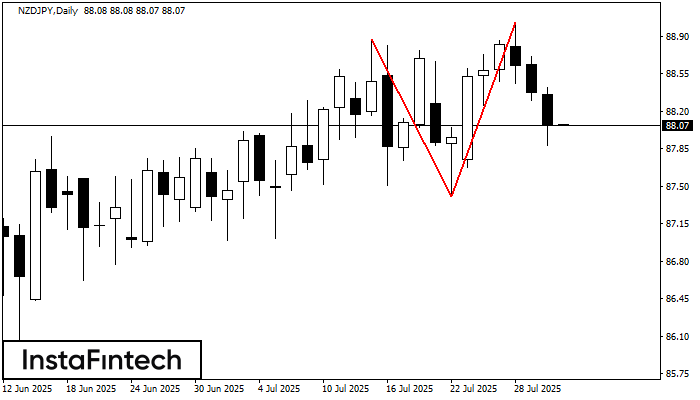
The Double Top pattern has been formed on NZDJPY D1. It signals that the trend has been changed from upwards to downwards. Probably, if the base of the pattern 87.40
Open chart in a new window