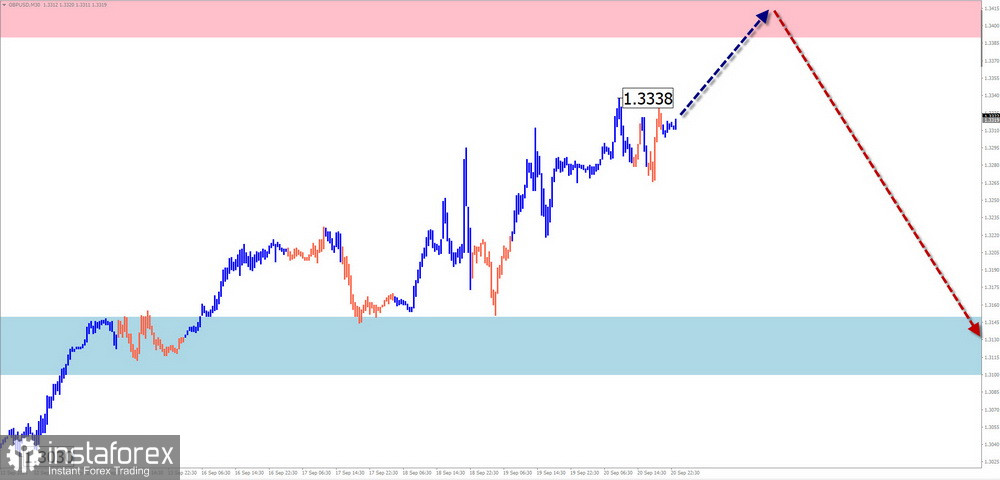
GBP/USD
Brief Analysis:
Since October of last year, the price trend direction of the main British pound pair has been driven by an upward wave algorithm. The quotes have reached the boundaries of the potential reversal zone on the weekly timeframe. An intermediate correction needs to form before the structure can continue its ascent. There are no clear signals of an imminent reversal on the chart.
Forecast for the Week:
In the upcoming week, the upward movement of the British pound is expected to conclude. Short-term pressure on the upper resistance boundary is possible in the early days. Afterward, a downward reversal in the price movement can be expected. Support lies at the lower level of the weekly timeframe's reversal zone.
Potential Reversal Zones
- Resistance: 1.3390/1.3440
- Support: 1.3150/1.3100
Recommendations:
- Buying: High-risk, potentially unprofitable.
- Selling: May become the primary trading direction if corresponding signals appear in your trading systems (TS).
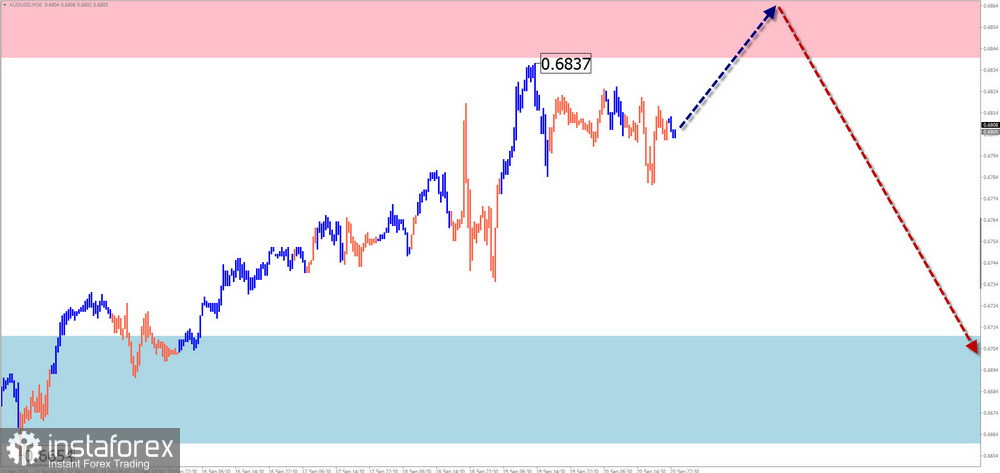
AUD/USD
Brief Analysis:
The upward wave zigzag that began in August has led the Australian dollar ("Aussie") to a powerful potential reversal zone. The wave structure at the time of analysis does not appear to be fully formed, with the ongoing corrective wave segment starting on September 19.
Forecast for the Week:
At the start of the upcoming week, an upward vector is more likely, with a flat movement characteristic. Toward the weekend, there is a higher likelihood of a reversal from the resistance zone, initiating a price decline. The projected support level limits the expected weekly range of the pair's movement.
Potential Reversal Zones
- Resistance: 0.6840/0.6890
- Support: 0.6710/0.6660
Recommendations:
- Buying: Can be used within individual sessions with a reduced trading volume. The potential is limited by resistance.
- Selling: Will be relevant after confirmed reversal signals appear around the resistance zone.
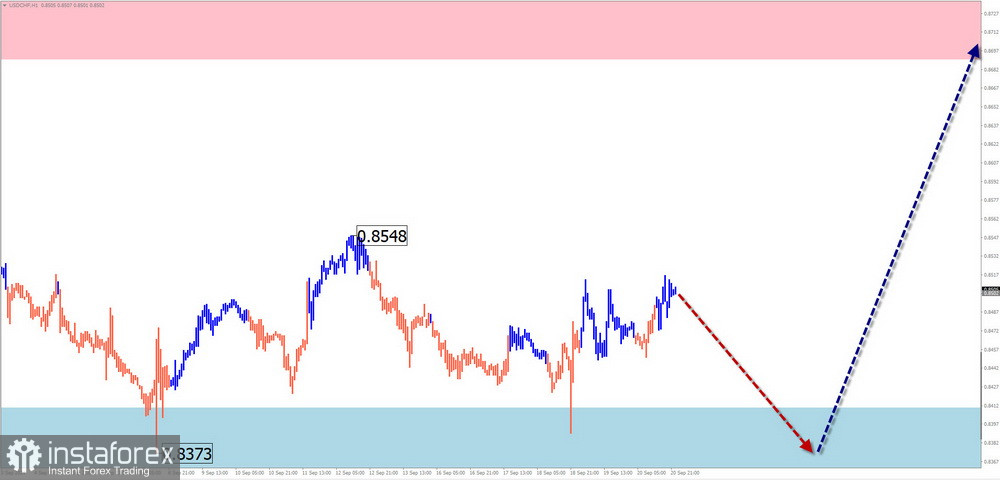
USD/CHF
Brief Analysis:
After the bearish wave that ended in early August, the price trend for the major Swiss franc pair is now being set by a bullish wave. Its strong potential suggests that the entire movement could transition to the daily timeframe. Over the past month, the quotes have been retracing downward, forming the corrective wave segment (B).
Forecast for the Week:
The coming week is expected to be similar in nature to recent periods. After likely movement along the support boundaries in the first few days, a resumption of the price rise can be expected by the weekend. The potential peak for price growth is indicated by the resistance level.
Potential Reversal Zones
- Resistance: 0.8690/0.8740
- Support: 0.8400/0.8350
Recommendations:
- Selling: Considered high-risk, with limited profit potential.
- Buying: May become the main trading direction if signals appear around the support zone in your trading systems.
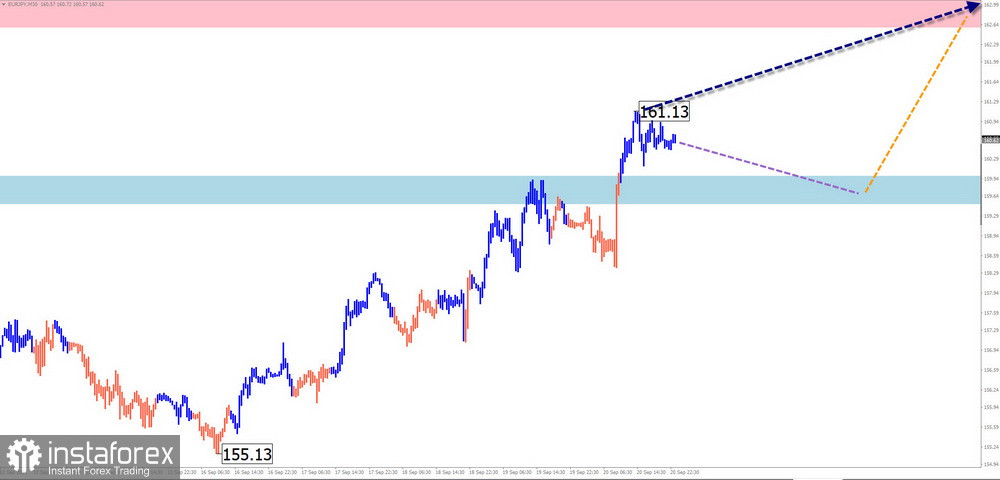
EUR/JPY
Brief Analysis:
Since the beginning of August, the short-term trend direction for the EUR/JPY pair has been dominated by an upward wave algorithm. Over the past four weeks, an unfinished corrective section of the wave has been developing. The upward movement from September 16 has reversal potential, which, if confirmed, will initiate the final part (C) of the main wave.
Forecast for the Week:
A brief sideways movement along the support boundaries is possible in the next couple of days. By mid-week, the likelihood of increased volatility, a change in direction, and a resumption of active price growth will increase.
Potential Reversal Zones
- Resistance: 162.60/163.10
- Support: 160.00/159.50
Recommendations:
- Selling: No conditions for trades.
- Buying: Can be used for trading. Signals from your trading systems can serve as entry points.
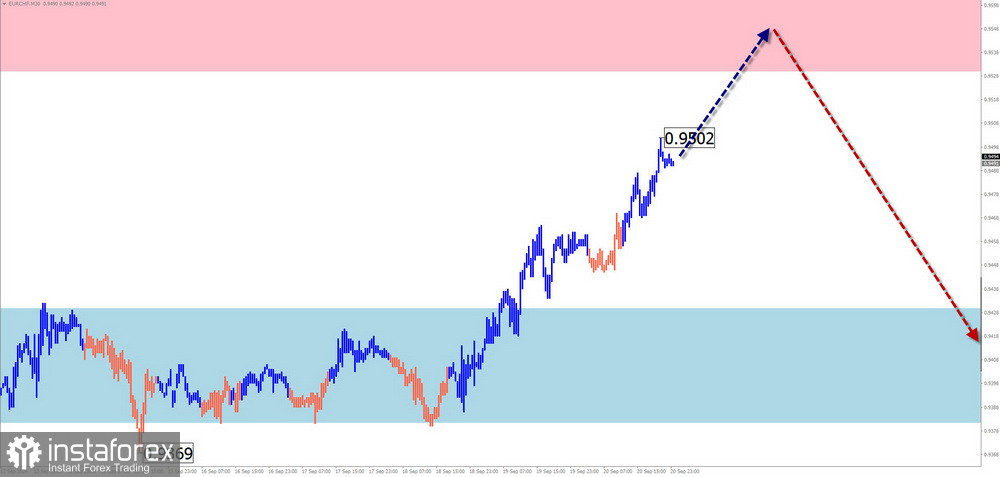
EUR/CHF
Brief Analysis:
The short-term trend direction for the EUR/CHF pair has been dominated by an upward wave since the beginning of August. For the past month and a half, a corrective plane has been forming within this structure, confined within a price channel between 0.9600 and 0.9300. The quotes are approaching the upper boundary of this channel, and the correction structure does not yet appear complete.
Forecast for the Week:
The bullish movement of the pair is expected to conclude this coming week. In the first half, there may be pressure on the resistance zone, and a brief breach of its upper boundary is possible. A reversal and a decline could occur by the end of the week.
Potential Reversal Zones
- Resistance: 0.9530/0.9580
- Support: 0.9430/0.9380
Recommendations:
- Buying: Possible with a reduced volume for intraday trading.
- Selling: Can be used for trading from the resistance zone after appropriate reversal signals appear in your trading systems.
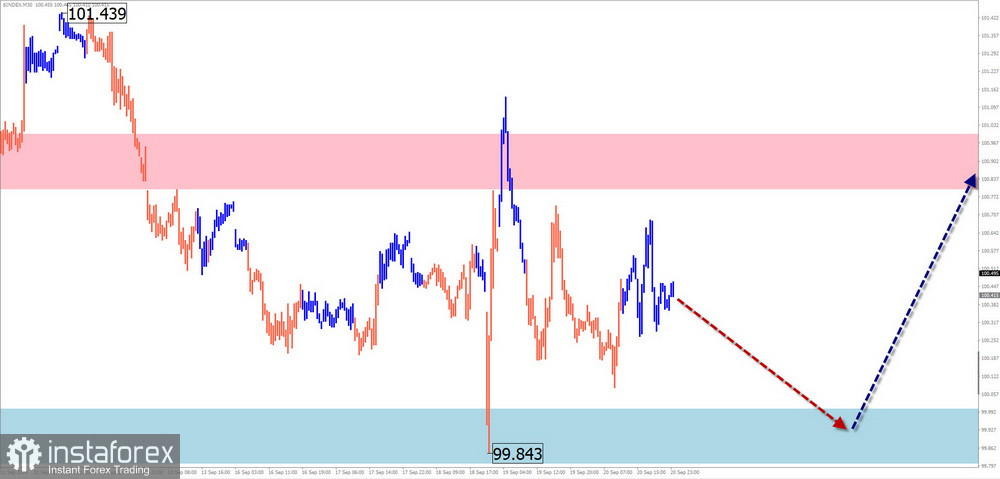
US Dollar Index
Brief Analysis:
The prolonged weakening of the U.S. dollar since mid-April is nearing its end. On the daily chart, this segment completes a wave zigzag. The price has reached the upper boundary of the potential reversal zone on the weekly timeframe. After testing this boundary, the dollar quotes began to move sideways.
Forecast for the Week:
In the first half of the upcoming week, continued movement along the support boundaries of the index is expected. A reversal and the start of an upward trend are more likely toward the end of the week. A change in direction will likely be accompanied by a sharp increase in volatility, triggered by any breaking news in the global economy.
Potential Reversal Zones
- Resistance: 100.80/101.00
- Support: 100.00/99.80
Recommendations:
- Selling the U.S. dollar in major pairs lacks potential. It's more prudent to take bearish positions against major currencies.
Note: In simplified wave analysis (SWA), all waves consist of three parts (A-B-C). The analysis focuses on the most recent, unfinished wave at each timeframe. Dotted lines represent expected movements.
Warning: The wave algorithm does not account for the duration of price movements over time!