برطانوی پاؤنڈ/امریکی ڈالر 5 منٹ کا تجزیہ
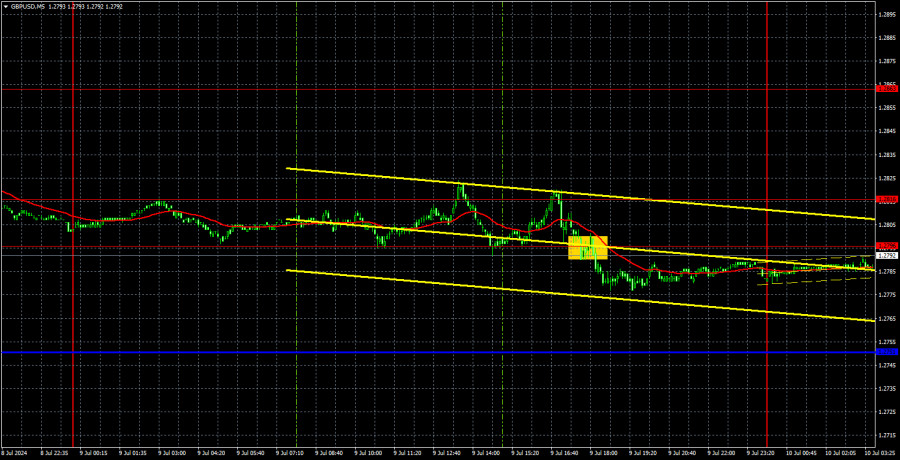
منگل کو GBP/USD قدرے 1.2796 کی سطح سے نیچے گر گیا۔ یاد رکھیں کہ سطح 1.2796 اور 1.2816 کو ایک حد کے طور پر سمجھا جانا چاہئے۔ اس لیے، پونڈ کا مقصد ممکنہ طور پر ڈیڑھ ہفتے کی ترقی کے بعد نیچے کی طرف ایک نئی حرکت شروع کرنا ہے۔ یقینا، موجودہ حالات میں پاؤنڈ کی گراوٹ پر یقین کرنا غیر ملکیوں پر یقین کرنے کے مترادف ہے۔ اس کے باوجود، ایک تکنیکی سگنل ہے، اور شاید جوڑی کم از کم تھوڑا سا درست کرے گا. اس کے علاوہ، ایک "سر اور کندھے" پیٹرن تشکیل دیا گیا ہے، جو واضح طور پر نظر آتا ہے. یہ ایک اور عنصر ہے جو پاؤنڈ کی کمی کو سہارا دے سکتا ہے۔
بدقسمتی سے، یہ ہفتہ پیٹرن اور تکنیکی اشاروں پر نہیں بلکہ امریکی افراط زر کی رپورٹ پر منحصر ہوگا۔ ابتدائی طور پر، امید تھی کہ فیڈرل ریزرو کے چیف جیروم پاول ڈالر کو سپورٹ کریں گے، لیکن وہ کافی سخت موقف پیش کرنے میں ناکام رہے، کیونکہ انہوں نے اس بات کا اعادہ کیا کہ "ہمیں انتظار کرنے کی ضرورت ہے،" اور مارکیٹ نے ایک بار پھر خریدنے کی ضرورت نہیں دیکھی۔ امریکی ڈالر. اگر کل کا امریکی افراط زر کا ڈیٹا پیشین گوئی کے اندر بھی سست روی کو ظاہر کرتا ہے، تو یہ مارکیٹ کے لیے USD کی فروخت جاری رکھنے کے لیے کافی ہوگا۔ اور یہ کہ پچھلی دو افراط زر کی رپورٹس میں بالکل ایسا ہی ہوا ہے، جس میں صرف ایک معمولی سست روی دکھائی گئی۔ ڈالر اس طرح گرا جیسے فیڈ نے دو بار شرح کم کی ہو۔
کل، تاجر صرف ایک تجارتی سگنل پر غور کر سکتے تھے۔ امریکی تجارتی سیشن کے دوران، قیمت 1.2796 کی سطح سے نیچے مستحکم ہو گئی، تاکہ تاجر مختصر پوزیشنیں کھول سکیں۔ اتار چڑھاؤ انتہائی کم رہتا ہے، اس لیے یہ توقع کرنا بہت مشکل تھا کہ جوڑے کے 20 پِپس تک بڑھے گی۔ اگر پاؤنڈ آخر کار گرنے کے راستے پر ہے، تو اسے کم از کم 100 پپس نیچے جانے میں کافی وقت لگے گا۔ امریکی افراط زر کی رپورٹ کل آنے والی ہے، اور مارکیٹ کا جذبہ تیزی سے تیزی سے بدل سکتا ہے...
GBP/USD slightly dropped below the 1.2796 level on Tuesday. Recall that the levels 1.2796 and 1.2816 should be considered as a range. Therefore, the pound probably aims to start a new downward movement after going through a one and a half week of growth. Of course, believing in the pound's decline under the current circumstances is like believing in aliens. Nevertheless, there is a technical signal, and perhaps the pair will correct lower at least a bit. In addition, a "head and shoulders" pattern has formed, which is clearly visible. This is another factor that can support the pound's decline.
Unfortunately, this week will not depend on patterns and technical signals but on the US inflation report. Initially, there was hope that Federal Reserve Chief Jerome Powell would support the dollar, but he failed to deliver a dovish-enough stance, as he reiterated that "we need to wait," and the market once again did not see the need to buy the US dollar. If tomorrow's US inflation data shows a slowdown even within the forecast, that will be enough for the market to continue the USD sell-off. And that this is exactly what happened in the last two inflation reports, which only showed a minor slowdown. The dollar plummeted as if the Fed had cut the rate twice.
Yesterday, traders could only consider one trading signal. During the U.S. trading session, the price consolidated below the 1.2796 level, so traders could open short positions. Volatility remains extremely low, so it was very difficult to expect the pair to move by 20 pips. If the pound is finally on track to decline, it will take a lot of time for it to move down at least 100 pips. The US inflation report is due tomorrow, and the market sentiment can quickly turn bullish...
COT report:
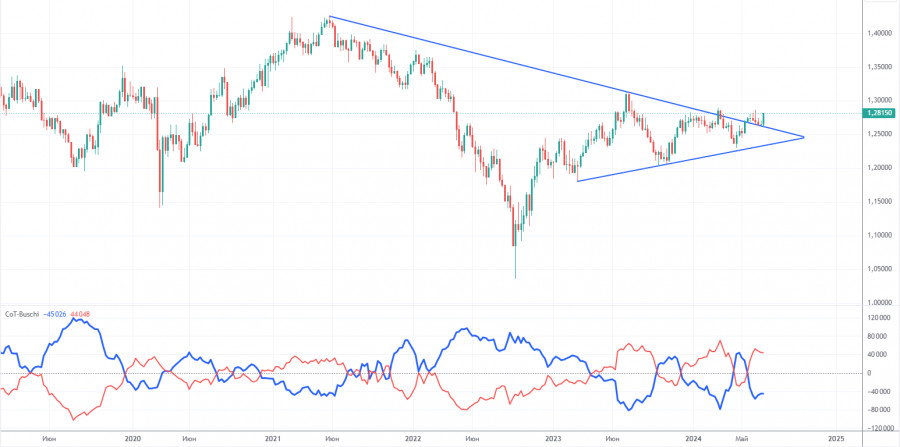
COT reports on the British pound show that the sentiment of commercial traders has frequently changed in recent years. The red and blue lines, which represent the net positions of commercial and non-commercial traders, constantly intersect and mostly remain close to the zero mark. According to the latest report on the British pound, the non-commercial group closed 3,400 buy contracts and opened 200 short ones. As a result, the net position of non-commercial traders decreased by 3,600 contracts over the week. Thus, sellers failed to seize the initiative.
The fundamental background still does not provide a basis for long-term purchases of the pound sterling, and the currency has a good chance to resume the global downward trend. However, the price has already breached the trend line on the 24-hour timeframe at least twice. The level of 1.2800 (which is the upper boundary of the sideways channel) is currently preventing the pound from rising further.
The non-commercial group currently has a total of 102,400 buy contracts and 58,500 sell contracts. The bulls are taking the lead in the market, but aside from the COT reports, nothing else suggests a potential rise in the GBP/USD pair. Such a strong advantage suggests that the pair may fall...
Analysis of GBP/USD 1H
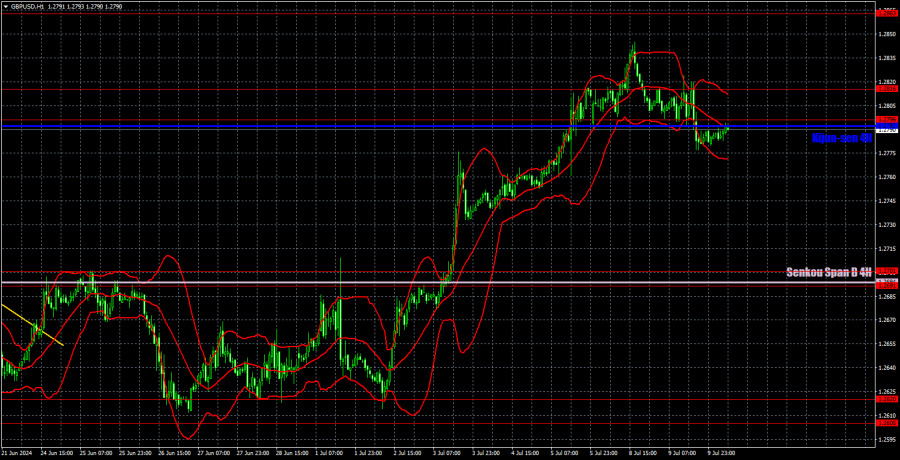
On the 1H chart, GBP/USD failed to overcome the 1.2605-1.2620 area. A new rebound from this area triggered another round of the corrective movement, and now the pair is near its 10-month highs. We expect the pound to fall in the medium-term, but the market is not interested in selling the pound regardless of the fundamental background. If the pair firmly overcomes the 1.2796-1.2816 area, we will consider the possibility of prolonging the upward trend. However, the pound has not firmly consolidated.
As of July 10, we highlight the following important levels: 1.2215, 1.2269, 1.2349, 1.2429-1.2445, 1.2516, 1.2605-1.2620, 1.2691-1.2701, 1.2796-1.2816, 1.2863, 1.2981-1.2987. The Senkou Span B (1.2694) and Kijun-sen (1.2792) lines can also serve as sources of signals. Don't forget to set a Stop Loss to breakeven if the price has moved in the intended direction by 20 pips. The Ichimoku indicator lines may move during the day, so this should be taken into account when determining trading signals.
No significant events are scheduled in the UK, while Powell's second round of testifying is due on Wednesday. Yesterday, Powell did not provide Congress with any new, important, or interesting information. It is unlikely that today's speech will differ from yesterday's... The pound currently has a good chance to fall, provided the US inflation report does not once again spoil things for the dollar...
Description of the chart:
Support and resistance levels are thick red lines near which the trend may end. They do not provide trading signals;
The Kijun-sen and Senkou Span B lines are the lines of the Ichimoku indicator, plotted to the 1H timeframe from the 4H one. They provide trading signals;
Extreme levels are thin red lines from which the price bounced earlier. They provide trading signals;
Yellow lines are trend lines, trend channels, and any other technical patterns;
Indicator 1 on the COT charts is the net position size for each category of traders;


