Analysis of EUR/USD 5M
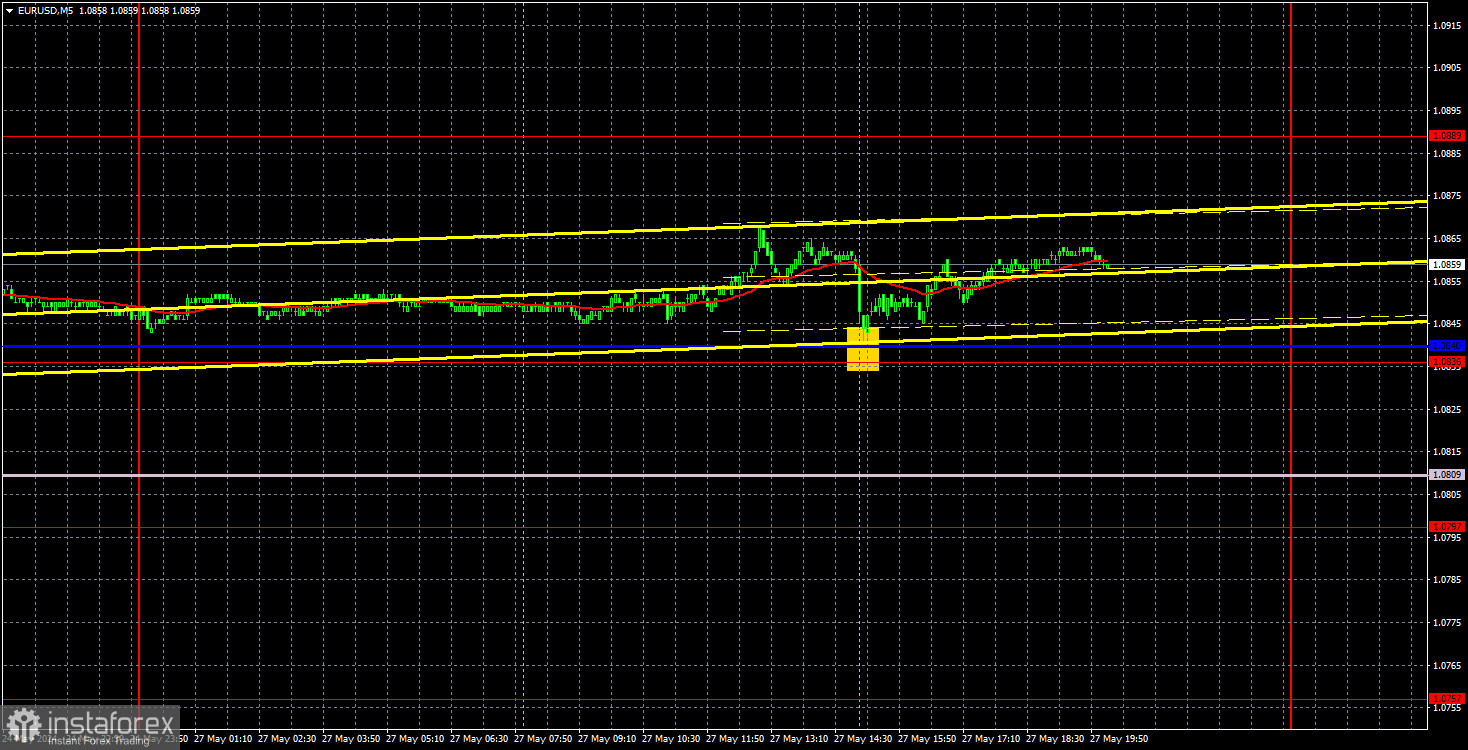
EUR/USD advanced on Monday. Volatility was a mere 27 pips, which is significantly lower than the usual. In general, there were no movements. It was impossible to trade under these conditions. However, the euro still managed to edge up. The 10-15 pip rise can be attributed to market noise. The change was so insignificant that it's not even worth discussing. Nevertheless, we insist that the euro simply refuses to fall, and to even correct when all the necessary conditions are present. Instead, the single currency can rise even without any justification, as what we have observed recently.
There were no significant events, which is clearly reflected in the pair's movements. The chief economist of the European Central Bank, Philip Lane, gave a speech but did not provide any new information to the market. He reiterated his colleagues' statements that June is an opportune time to lower the key rate, which should have triggered a decline in the euro, not its rise. Thus, the market continues to ignore the fundamental and macroeconomic background.
Amidst low volatility, the pair formed one trading signal. At the beginning of the US trading session, the price bounced off the critical line and then managed to rise by 10 pips. If any traders capitalized on this signal, they might have made a small profit.
COT report:
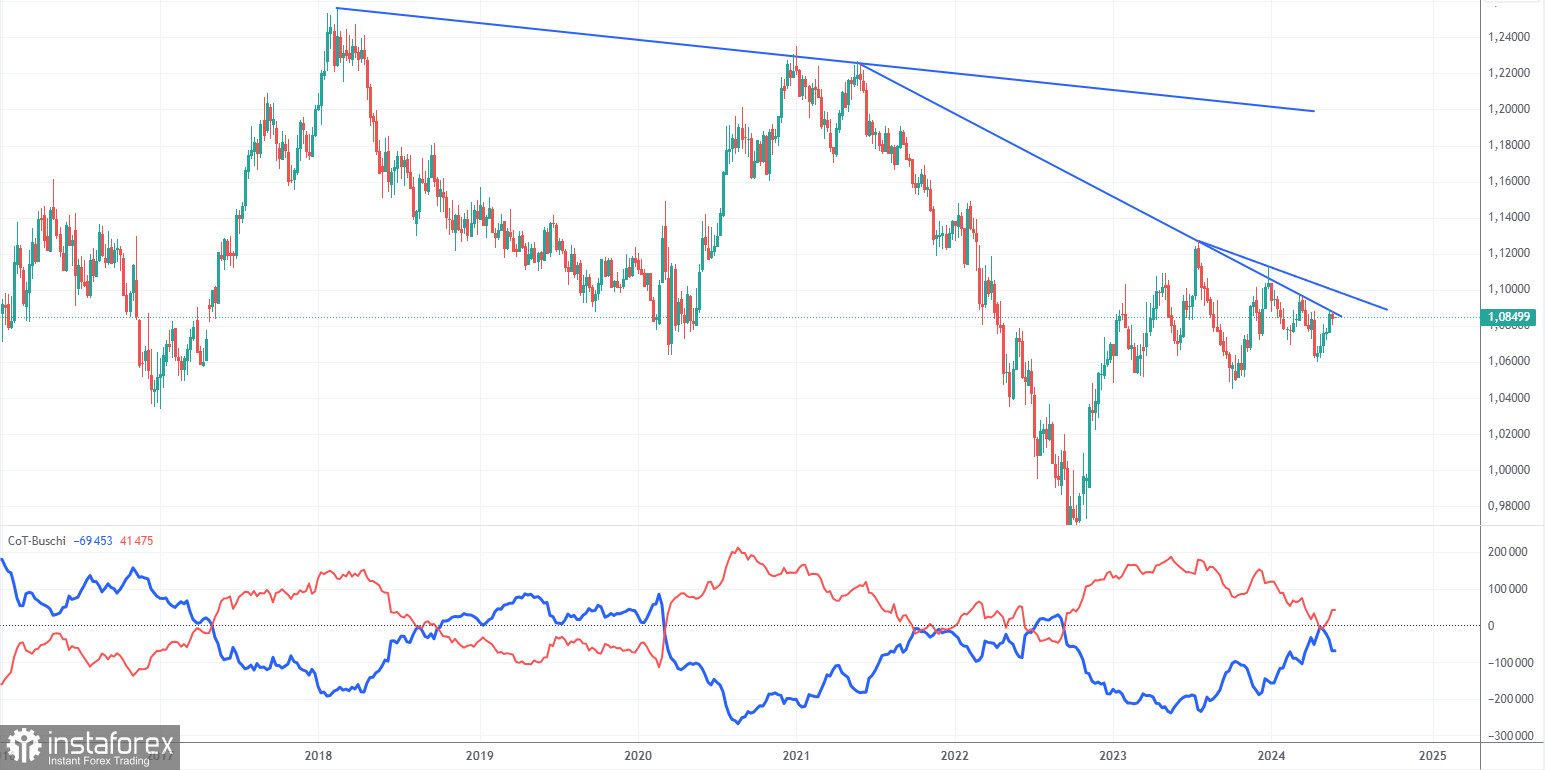
The latest COT report is dated May 21. The net position of non-commercial traders has remained bullish for a long time, but now the situation is finally changing. The net position of non-commercial traders (red line) has been decreasing in recent months, while that of commercial traders (blue line) has been increasing. This shows that market sentiment is turning bearish, as speculators increasingly sell the euro. Currently, their positions coincide in terms of volume. We don't see any fundamental factors that can support the euro's strength, while technical analysis also suggests a continuation of the downtrend. Three descending trend lines on the weekly chart suggests that there's a good chance of further decline.
The red and blue lines have crossed, and now the bears might gain a significant advantage. So we strongly support the euro's decline. During the last reporting week, the number of long positions for the non-commercial group increased by 4,100, while the number of short positions decreased by 20,100. Accordingly, the net position increased by 16,000. Overall, both the euro and the net position continue to decline.
Analysis of EUR/USD 1H
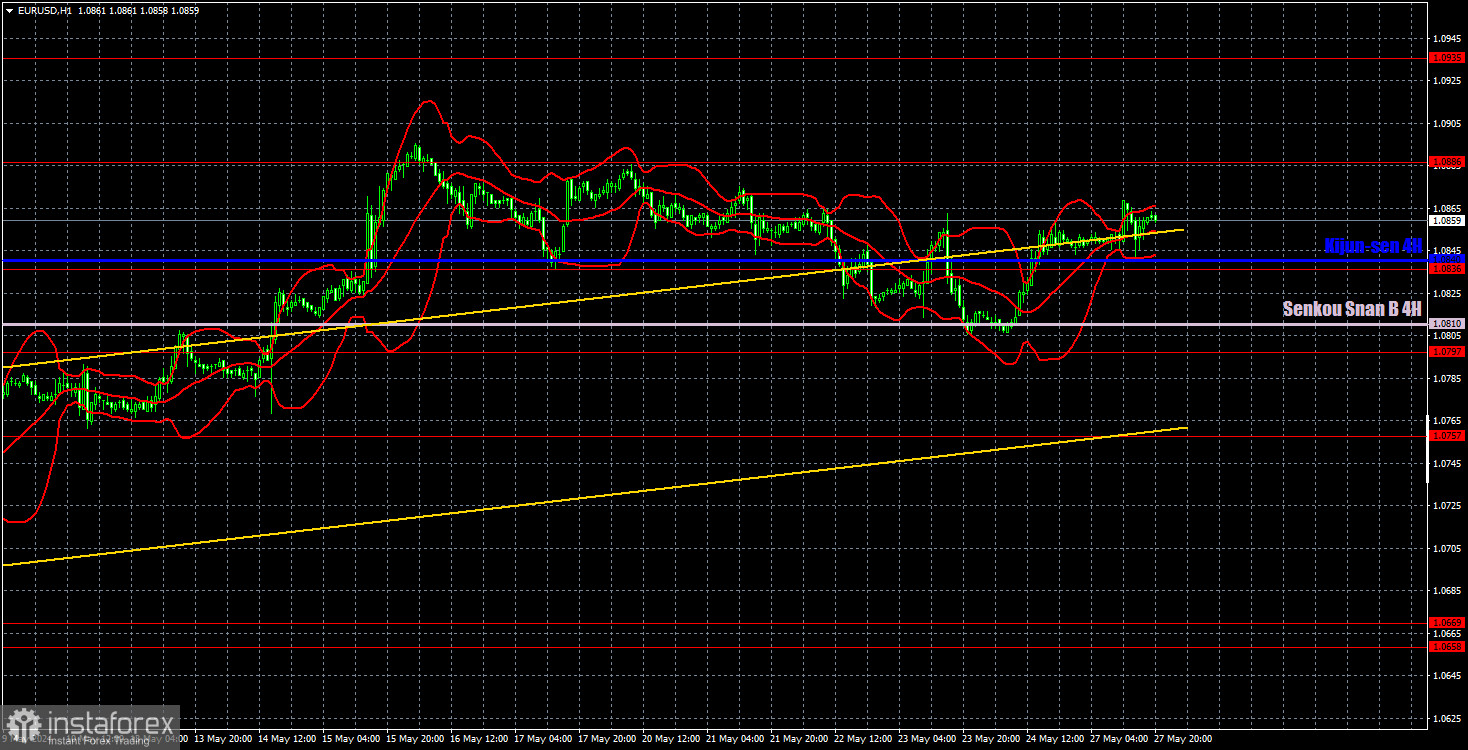
On the 1-hour chart, the EUR/USD pair has been going through a weak but steady bullish correction against the broader downtrend for over a month. Since expectations for a Federal Reserve rate cut in 2024 have significantly decreased, and the ECB is ready to lower rates in just two weeks, we believe that the US currency should rise in the medium term. We still expect the price to consolidate below the ascending channel so the downtrend can resume. However, it appears that the market is not ready to buy the dollar and is generally not ready to trade. The euro simply rises almost every day or simply stands still.
On May 28, we highlight the following levels for trading: 1.0530, 1.0581, 1.0658-1.0669, 1.0757, 1.0797, 1.0836, 1.0886, 1.0935, 1.1006, 1.1092, as well as the Senkou Span B (1.0810) and Kijun-sen (1.0840) lines. The Ichimoku indicator lines can move during the day, so this should be taken into account when identifying trading signals. Don't forget to set a Stop Loss to breakeven if the price has moved in the intended direction by 15 pips. This will protect you against potential losses if the signal turns out to be false.
On Tuesday, there are no interesting events or reports planned in the European Union and the United States. So today we don't expect anything interesting; most likely, we will see another boring day.
Description of the chart:
Support and resistance levels are thick red lines near which the trend may end. They do not provide trading signals;
The Kijun-sen and Senkou Span B lines are the lines of the Ichimoku indicator, plotted to the 1H timeframe from the 4H one. They provide trading signals;
Extreme levels are thin red lines from which the price bounced earlier. They provide trading signals;
Yellow lines are trend lines, trend channels, and any other technical patterns;
Indicator 1 on the COT charts is the net position size for each category of traders;