Analysis of GBP/USD 5M
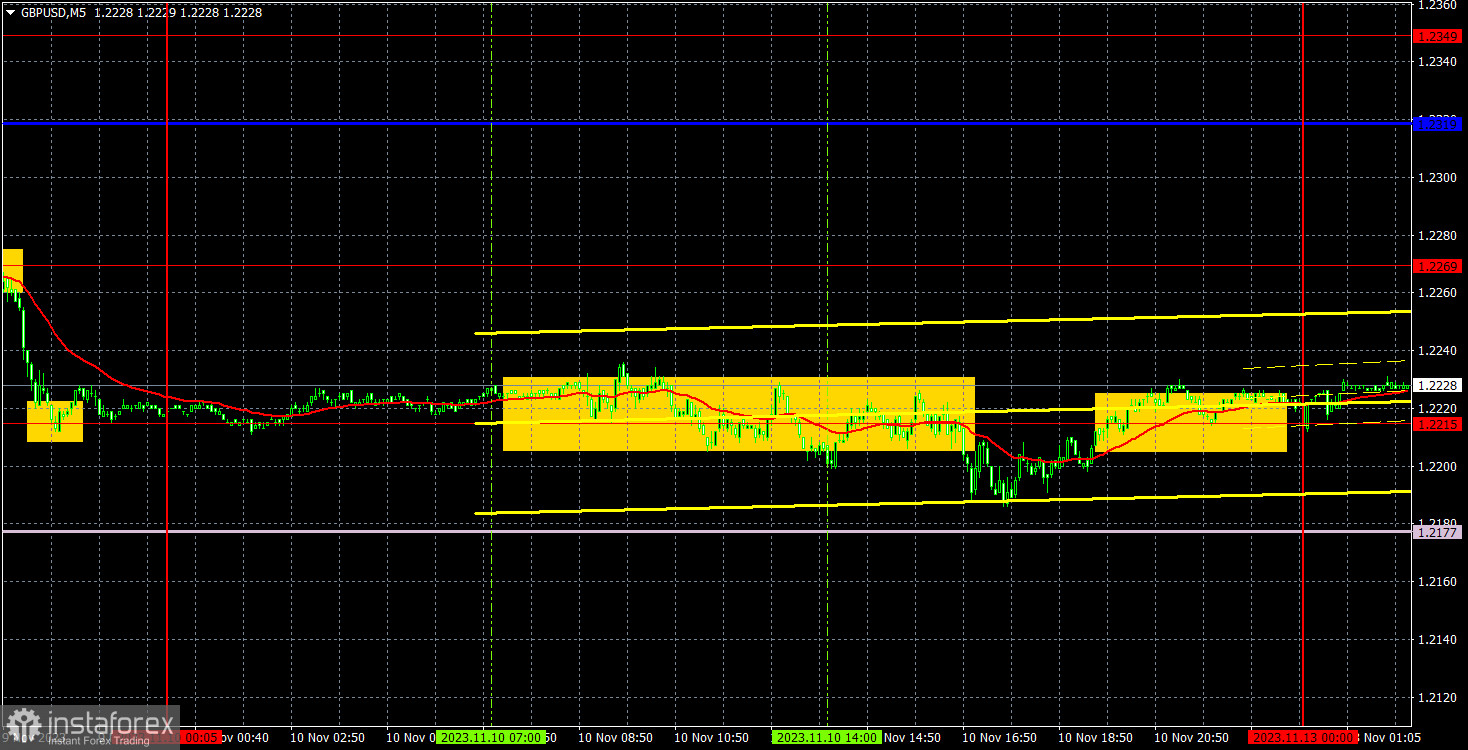
GBP/USD also traded with low volatility on Friday, mainly sideways. The only difference is that the British pound had two important reports at its disposal, which could have slightly stirred the market. However, the values of these reports turned out to be neutral and had no impact on the pair's movement. The UK's GDP remained unchanged in the third quarter, and industrial production volume in September also remained unchanged. In general, there was nothing to react to. Like the euro, the pound is currently between the Senkou Span B and Kijun-sen lines, maintaining the possibility of continuing both downward and upward movements. We are expecting a downward movement, but in order for that to happen this week, the pair must overcome the Senkou Span B.
There is no point in considering Friday's trading signals. The pair moved along the level of 1.2215 throughout the day, and it only managed to move away from it once. That happened almost in the evening when it was clear that there would be no significant movements. Therefore, the best decision was to stay out of the market on Friday.
COT report:
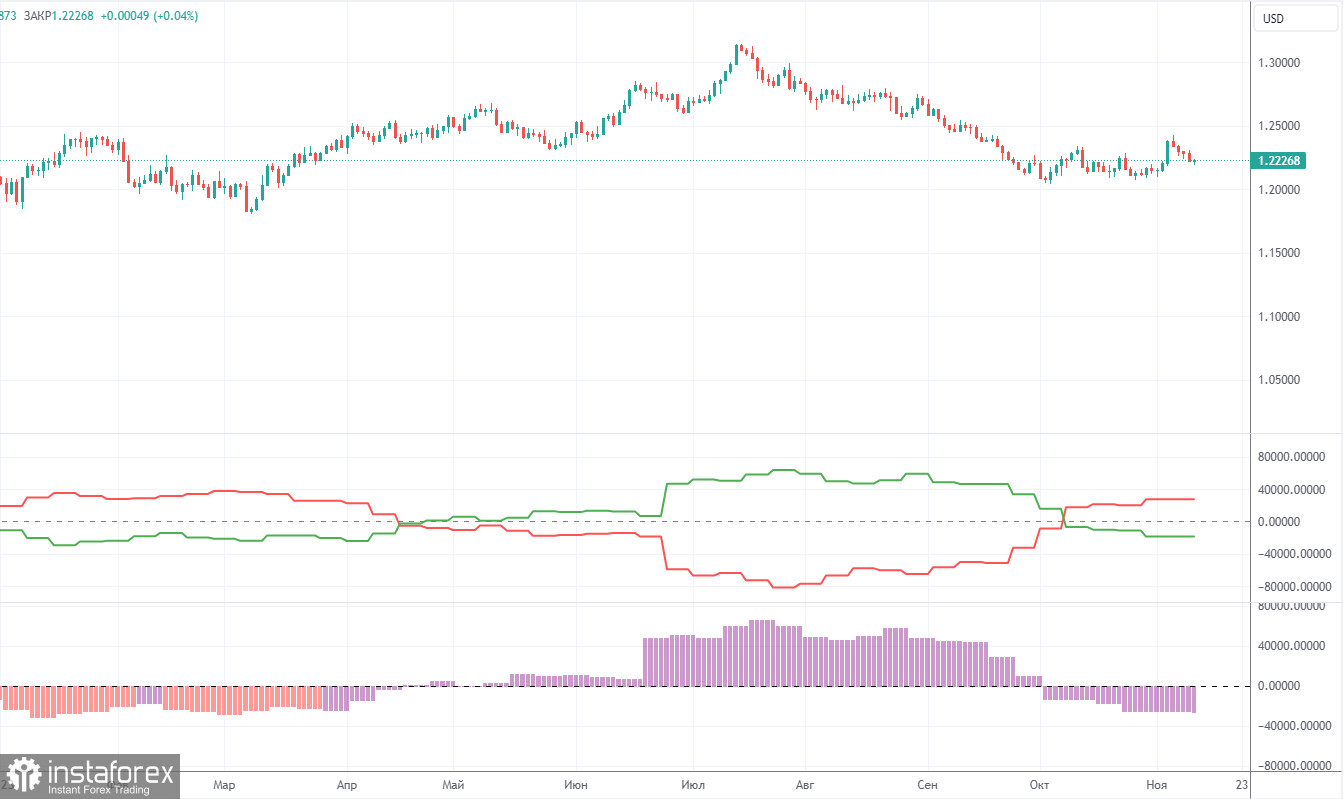
COT reports on the British pound also align perfectly with what's happening in the market. According to the latest report on GBP/USD, the non-commercial group closed 3,400 long positions and 1,700 short ones. Thus, the net position of non-commercial traders decreased by another 1,700 contracts in a week. The net position indicator has been steadily rising over the past 12 months, but it has been firmly decreasing over the past three months. The British pound is also losing ground. We have been waiting for many months for the sterling to reverse downwards. Perhaps GBP/USD is at the very beginning of a prolonged downtrend. At least in the coming months, we do not see significant prospects for the pound to rise, and even if we're currently witnessing a corrective phase, it could persist for several months.
The British pound has surged by a total of 2,800 pips from its absolute lows reached last year, which is an enormous increase. Without a strong downward correction, a further upward trend would be entirely illogical (if it is even planned). We don't rule out an extension of an uptrend. We simply believe that a substantial correction is needed first, and then we should assess the factors supporting the US dollar and the British pound. A correction to the level of 1.1844 would be enough to establish a fair balance between the two currencies. The non-commercial group currently holds a total of 63,700 longs and 85,800 shorts. The bears have been holding the upper hand in recent months, and we believe this trend will continue in the near future.
Analysis of GBP/USD 1H
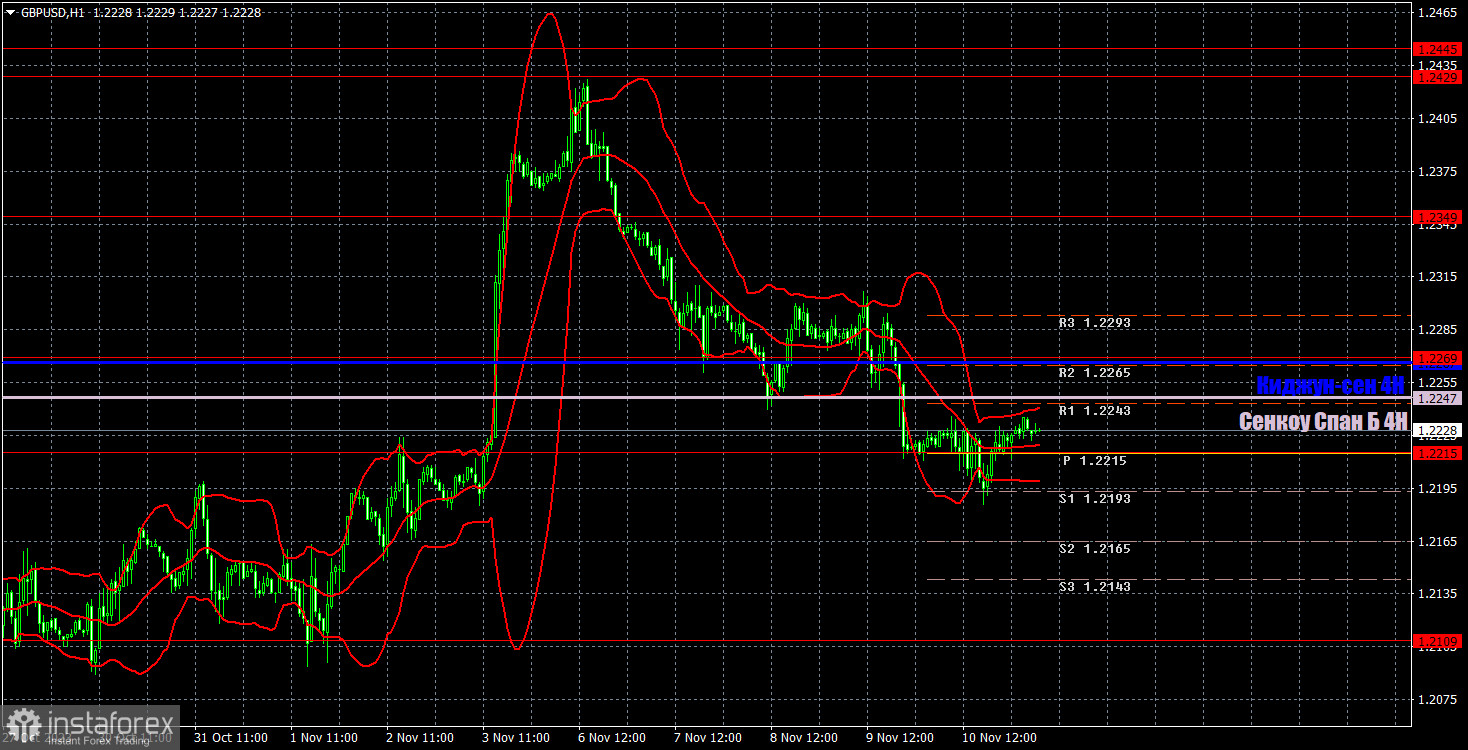
On the 1H chart, GBP/USD has finally formed an upward movement, which could serve as a convincing conclusion to the entire bullish correction, which lasted for more than a month. The pair has started to fall, and on the hourly chart, it surpassed the Senkou Span B line. Therefore, the pound may fall further, according to our expectations and calculations.
As of November 13, we highlight the following important levels: 1.1760, 1.1874, 1.1927-1.1965, 1.2052, 1.2109, 1.2215, 1.2269, 1.2349, 1.2429-1.2445, 1.2520, 1.2605-1.2620, 1.2693. The Senkou Span B (1.2247) and Kijun-sen (1.2267) lines can also be sources of signals. Signals can be "bounces" and "breakouts" of these levels and lines. It is recommended to set the Stop Loss level to break-even when the price moves in the right direction by 20 pips. The Ichimoku indicator lines can move during the day, which should be taken into account when determining trading signals. The illustration also includes support and resistance levels that can be used to lock in profits from trades.
On Monday, there are no important events or reports scheduled in the UK or the US. Therefore, after a dull Friday, we can expect another boring Monday accompanied by sluggish movements and low volatility.
Description of the chart:
Support and resistance levels are thick red lines near which the trend may end. They do not provide trading signals;
The Kijun-sen and Senkou Span B lines are the lines of the Ichimoku indicator, plotted to the 1H timeframe from the 4H one. They provide trading signals;
Extreme levels are thin red lines from which the price bounced earlier. They provide trading signals;
Yellow lines are trend lines, trend channels, and any other technical patterns;
Indicator 1 on the COT charts is the net position size for each category of traders;
Indicator 2 on the COT charts is the net position size for the Non-commercial group.