Analysis of EUR/USD 5M
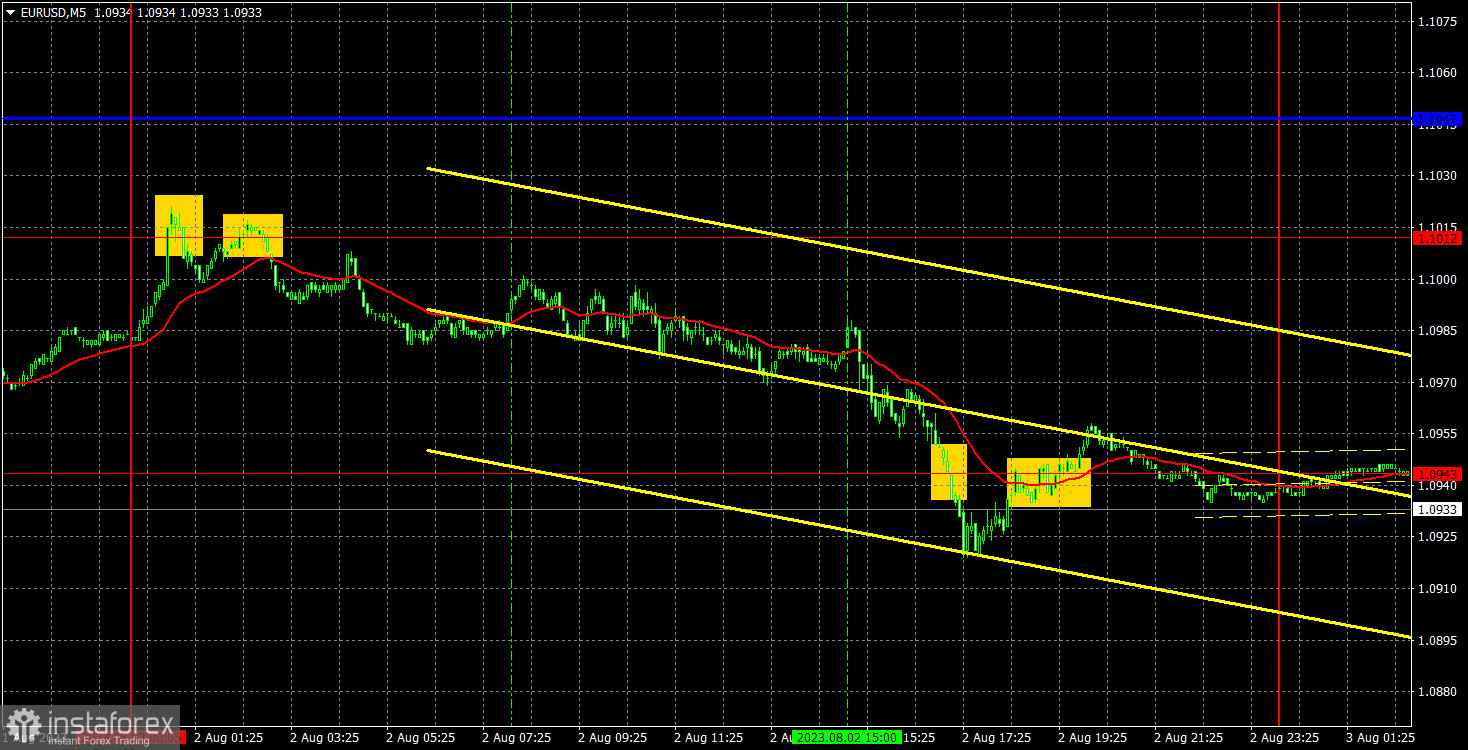
The EUR/USD pair extended its downtrend on Wednesday. In general, the euro has been trading lower for several consecutive weeks, which we have not seen for quite some time. Although it did not experience significant and active growth in 2023, demand for it was consistently high. As we have mentioned before, US macro data have been much stronger than in the EU, and the market is essentially held hostage to its own high expectations for the European Central Bank's interest rates. Now, as it becomes clear that the ECB is ready to pause and not continue aggressive tightening, the euro started to fall, which, from our perspective, is absolutely logical and should have happened a few months ago.
Yesterday, the ADP report turned out to be twice as strong as the forecasts. While it is not the most important indicator of the labor market, traders reacted to it as the dollar is currently "on top." There were several entry points. Two sell signals were formed overnight, but they could be executed with the opening of the European session, as by that time, the pair had moved very close to the point of formation. As a result, the price continued to fall throughout the day, and it was only with a buy signal in the evening that short positions should have been closed. The profit amounted to about 40 pips.
COT report:
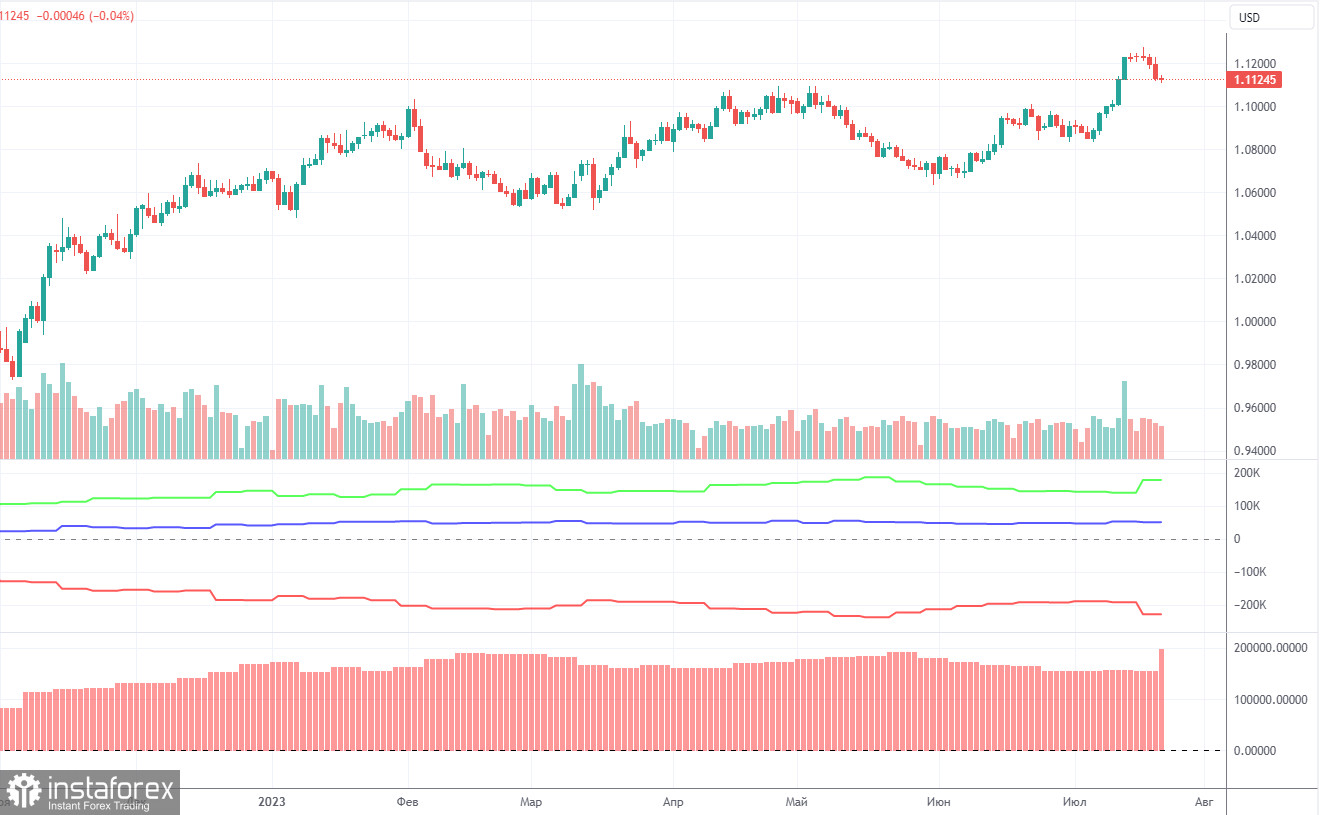
On Friday, a new COT report for July 25 was released. In the last 10 months, COT reports fully corresponded to what is happening in the market. The chart above clearly shows that the net position of major traders (the second indicator) began to grow in September 2022 and at about the same time the euro started climbing too. In the last 5-6 months, the net position has not risen but the euro remains at very high levels. At the moment, the net position of non-commercial traders is bullish. The euro keeps climbing against the US dollar.
I have already mentioned the fact that a fairly high value of the net position signals the end of an uptrend. This is also confirmed by the first indicator where the red and green lines are very far from each other. Usually, it precedes the end of the trend. During the last reporting week, the number of long positions of the non-commercial group of traders increased by 13,800 and the number of short ones by 12,200. The net position increased by 1,600 contracts. The number of long positions is higher than the number of short ones of non-commercial traders by 177,000. This is a very large gap as the difference is almost threefold. Even without COT reports, it is obvious that the euro should decline but speculators are still in no hurry to sell.
Analysis of EUR/USD 1H
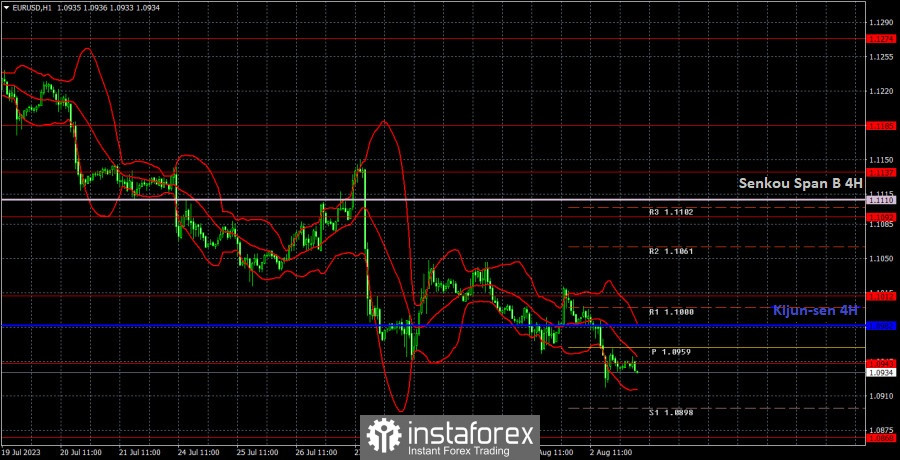
On the 1H chart, the euro/dollar pair resumed its downtrend. We insist that the euro should fall, but this week there will be important events and reports that could trigger strong movements in the pair. The market ignored the first set of reports on Monday and Tuesday, but the US dollar received a boost from the US ADP report on Wednesday.
On August 6, traders should pay attention to the following key levels: 1.0762, 1.0806, 1.0868, 1.0943, 1.1012, 1.1092, 1.1137, 1.1185, 1.1274, as well as the Senkou Span B line (1.1110) and the Kijun-sen line (1.0982). The lines of the Ichimoku indicator can move during the day, which should be taken into account when determining trading signals. There are support and resistance levels that can be used to lock in profits. Traders look for signals at rebounds and breakouts. It is recommended to set the Stop Loss orders at the breakeven level when the price moves in the right direction by 15 pips. This will protect against possible losses if the signal turns out to be false.
Today, the EU will release its final estimate for its Services PMI for July. Not the most significant report. The US will publish data on initial jobless claims and an important report on the ISM index for the services sector. The Bank of England will also announce its interest rate decision, and this event may also affect the EUR/USD pair.
Description of the chart:
Support and resistance levels are thick red lines near which the trend may end. They do not provide trading signals;
The Kijun-sen and Senkou Span B lines are the lines of the Ichimoku indicator, plotted to the 1H timeframe from the 4H one. They provide trading signals;
Extreme levels are thin red lines from which the price bounced earlier. They provide trading signals;
Yellow lines are trend lines, trend channels, and any other technical patterns;
Indicator 1 on the COT charts is the net position size for each category of traders;
Indicator 2 on the COT charts is the net position size for the Non-commercial group.