empty
 
 
05.07.2023 08:21 AM
GBP/USD: Forecast and trading signals on July 5, 2023. COT report. Detailed analysis of price movement and trades. The pound found a reason to grow even on a muted day

5M chart of GBP/USD

This image is no longer relevant

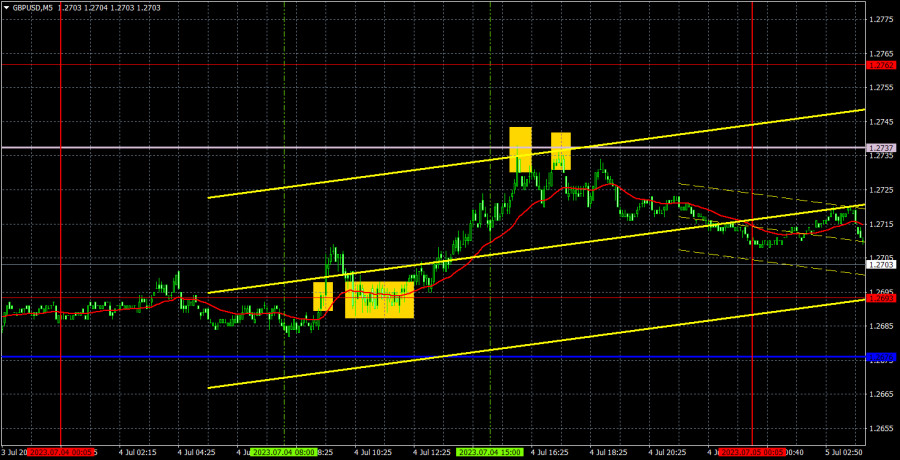
The GBP/USD pair surprisingly edged higher on Tuesday. Volatility was naturally very low, but nevertheless, the pound sterling moved from the day's low to its high by about 60 points. Along the way, it even formed several good trading signals. Thus, even on a muted day with no economic data scheduled in the calendar, the market found reasons for long positions on the pound. Therefore, we can expect the upward movement to be ignited, as GBPUSD has been in a prolonged uptrend since October 2022. This trend has been driven by momentum, and the pound's growth is groundless. However, keep in mind that the market can push the pair in any direction even without justifications.

Two buy signals materialized during the European trading session. First, the pair overcame the level of 1.2693, and then rebounded from it from above, duplicating the buy signal. At the beginning of the US session, it reached the Senkou Span B line (twice), that is, a sell signal was formed. Therefore, long positions needed to be closed and short ones opened. There were no more signals for the rest of the day, so shorts should have been closed manually closer to the evening. Both deals turned out to be profitable, with a total profit of about 35 points.

COT report:

This image is no longer relevant

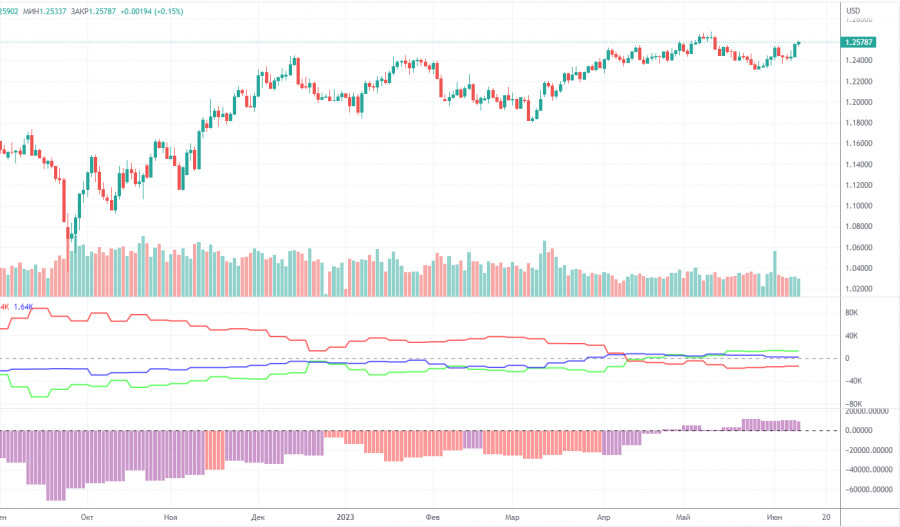
According to the latest report, non-commercial traders opened 2,800 long positions and closed 2,500 short ones. The net position increased by 5,300 in just a week and continues to grow. Over the past 9-10 months, the net position has been on the rise. We are approaching a point where the net position has grown too much to expect further growth. We assume that a prolonged bear run may soon begin, even though COT reports suggest a bullish continuation. It is becoming increasingly difficult to believe in it with each passing day. We can hardly explain why the uptrend should go on. However, there are currently no technical sell signals.

The pound has gained about 2,500 pips. Therefore, a bearish correction is now needed. Otherwise, a bullish continuation would make no sense. Overall, non-commercial traders hold 52,300 sell positions and 104,400 long ones. Such a gap suggests the end of the uptrend. We do not see the pair extending growth in the long term.

1H chart of GBP/USD

This image is no longer relevant

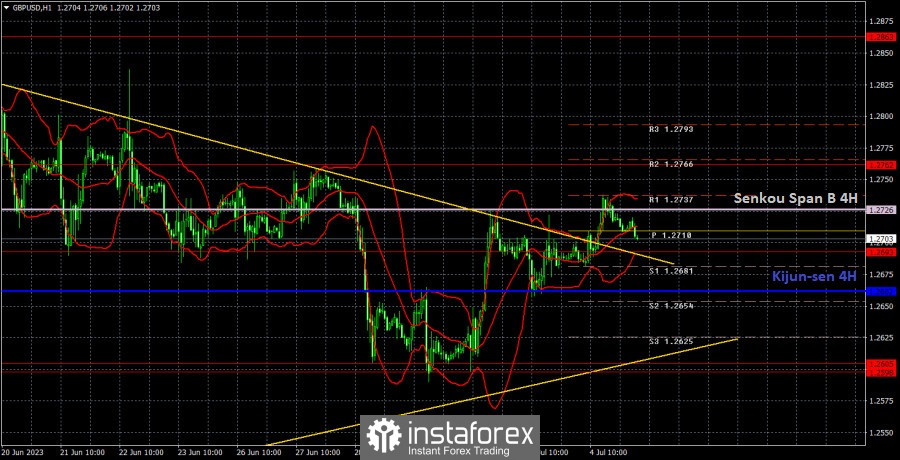
In the 1-hour chart, GBP/USD maintains a bullish bias, although it is correcting at the moment. The ascending trend line serves as a buy signal. However, we still believe that the British currency is overvalued and should fall in the medium term. The pair overcame the downward trend line, so the pound has an opportunity to show another round of the uptrend. So far, it has not crossed the Senkou Span B line, but it is the last line of defense on the way to a new uptrend.

On July 5, trading levels are seen at 1.2349, 1.2429-1.2445, 1.2520, 1.2598-1.2605, 1.2693, 1.2762, 1.2863, 1.2981-1.2987. The Senkou Span B (1.2726) and Kijun-sen (1.2662) may also generate signals when the price either breaks or bounces off them. A Stop Loss should be placed at the breakeven point when the price goes 20 pips in the right direction. Ichimoku indicator lines can move intraday, which should be taken into account when determining trading signals. There are also support and resistance which can be used for locking in profits.

On Wednesday, services PMI numbers for the UK in the second estimate for June will be released. Not the most significant indicator. We have the FOMC minutes for release in the US, which rarely contains important information. The pair will likely go through low volatility, but as we can see, the lack of news does not prevent the pound from rising against the USD.

Indicators on charts:

Resistance/support - thick red lines, near which the trend may stop. They do not make trading signals.

The Kijun-sen and Senkou Span B lines are the Ichimoku indicator lines moved to the hourly timeframe from the 4-hour timeframe. They are also strong lines.

Extreme levels are thin red lines, from which the price used to bounce earlier. They can produce trading signals.

Yellow lines are trend lines, trend channels, and other technical patterns.

Indicator 1 on the COT chart is the size of the net position of each trader category.

Indicator 2 on the COT chart is the size of the net position for the Non-commercial group of traders.

Paolo Greco,
انسٹافاریکس کا تجزیاتی ماہر
© 2007-2024
انسٹافاریکس کے ساتھ کرپٹو کرنسی کی معاملاتی تبدیلیوں سے کمائیں۔
میٹا ٹریڈر 4 ڈاؤن لوڈ کریں اور اپنی پہلی ٹریڈ کھولیں۔
  • Grand Choice
    Contest by
    InstaForex
    InstaForex always strives to help you
    fulfill your biggest dreams.
    مقابلہ میں شامل ہوں
  • چانسی ڈیپازٹ
    اپنے اکاؤنٹ میں 3000 ڈالر جمع کروائیں اور حاصل کریں$6000 مزید!
    ہم دسمبر قرعہ اندازی کرتے ہیں $6000چانسی ڈیپازٹ نامی مقابلہ کے تحت
    اپنے اکاؤنٹ میں 3000 ڈالر جمع کروانے پر موقع حاصل کریں - اس شرط پر پورا اُترتے ہوئے اس مقابلہ میں شرکت کریں
    مقابلہ میں شامل ہوں
  • ٹریڈ وائز، ون ڈیوائس
    کم از کم 500 ڈالر کے ساتھ اپنے اکاؤنٹ کو ٹاپ اپ کریں، مقابلے کے لیے سائن اپ کریں، اور موبائل ڈیوائسز جیتنے کا موقع حاصل کریں۔
    مقابلہ میں شامل ہوں
  • 100 فیصد بونس
    اپنے ڈپازٹ پر 100 فیصد بونس حاصل کرنے کا آپ کا منفرد موقع
    بونس حاصل کریں
  • 55 فیصد بونس
    اپنے ہر ڈپازٹ پر 55 فیصد بونس کے لیے درخواست دیں
    بونس حاصل کریں
  • 30 فیصد بونس
    ہر بار جب آپ اپنا اکاؤنٹ ٹاپ اپ کریں تو 30 فیصد بونس حاصل کریں
    بونس حاصل کریں

تجویز کردہ مضامین

ابھی فوری بات نہیں کرسکتے ؟
اپنا سوال پوچھیں بذریعہ چیٹ.
Widget callback