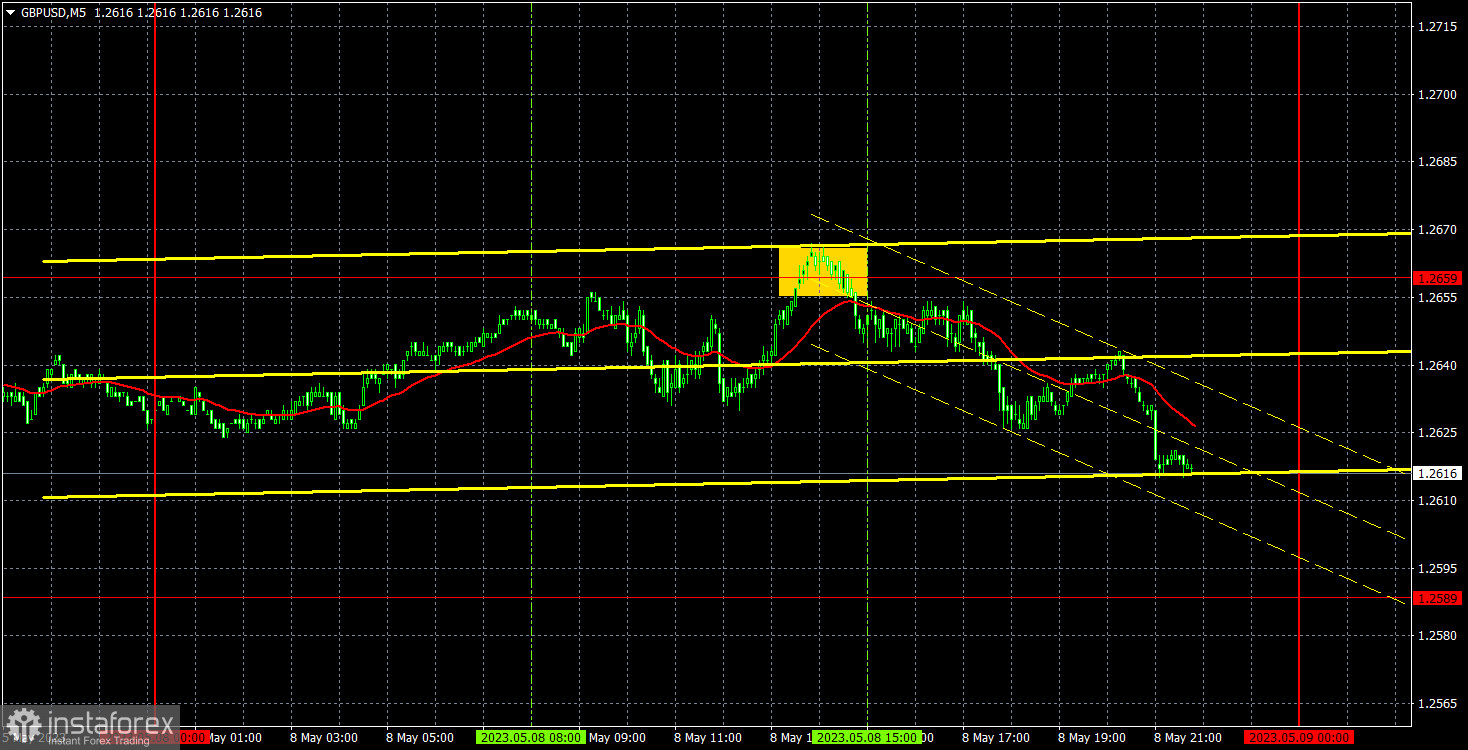
5M chart of GBP/USD
The GBP/USD pair also traded with low volatility on Monday. At least the pound didn't rise further, which was not entirely ruled out. But during the day, the pair still rolled back down by a few dozen points, which could be a simple pullback that could end the day, or it could be the beginning of a correction that is also unlikely to be strong. The new ascending trend line remains relevant, and the price is quite far from it. Therefore, there is ample space for a correction while maintaining the uptrend. On Monday, there was no macro data or fundamentals in the UK or the US. There was nothing to react to, which explains why volatility was very low.
There was only one trading signal during the day, and traders could even make money from it. Before the US trading session, the pair bounced off the 1.2659 level. It didn't bounce very precisely, but a short position could still be opened. Subsequently, it passed about 15-20 points downwards, and traders could have made money on it. The position should have been closed manually closer to the evening, as there was still no chance of reaching the target level with such volatility. The pound remains very high, unfairly high. It is overbought, but there is still no significant correction.
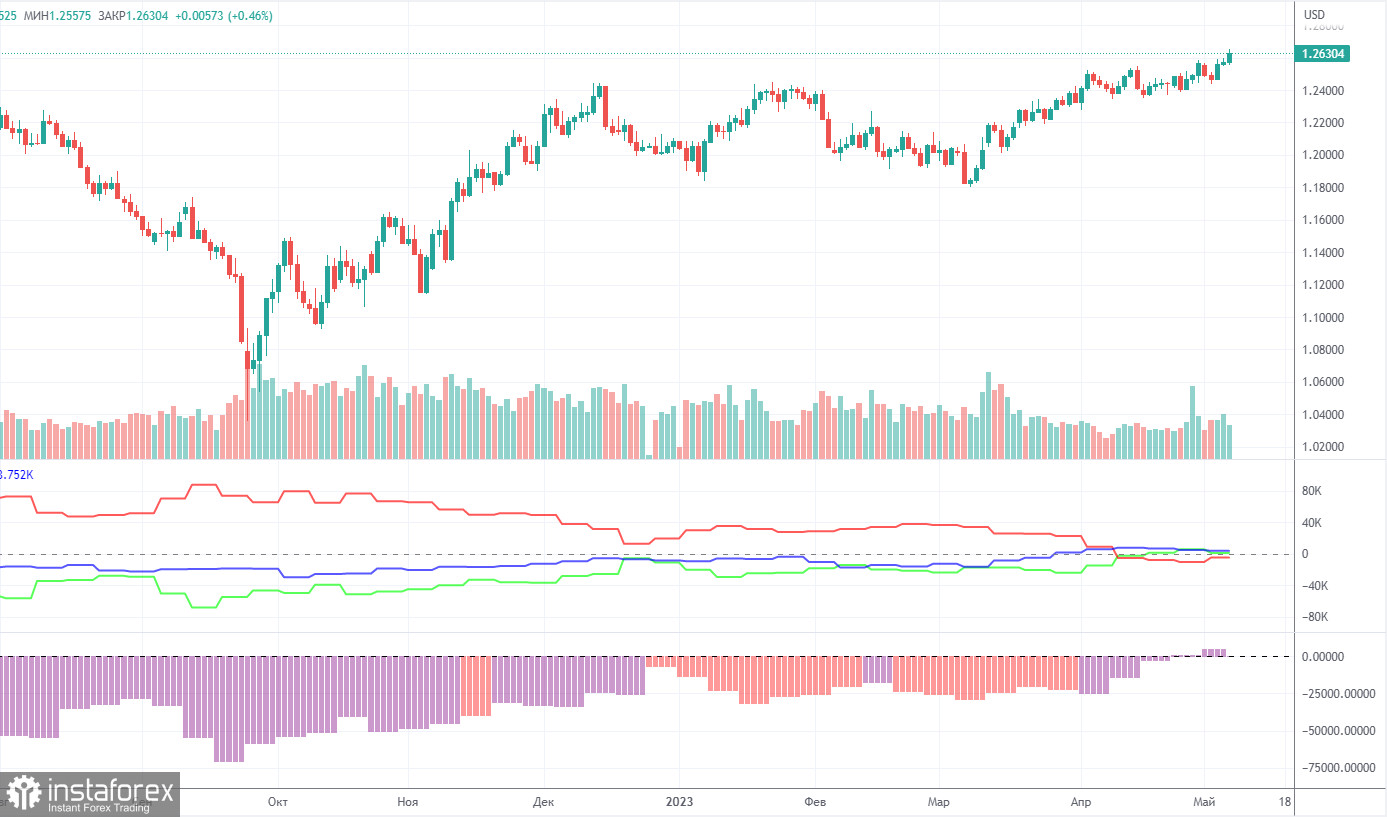
COT report:
According to the latest report on the British pound, the non-commercial group of traders closed 700 BUY contracts and opened 4,000 SELL contracts. Thus, the net position of the non-commercial group of traders decreased by 4,700 but in general, it continues to grow. The net position has been steadily rising for the past 8-9 months, but the sentiment of major market players remained bearish during this time. It has turned slightly bullish just recently. Although the British pound is strengthening against the US dollar in the medium term, it is hard to explain this behavior from the fundamental point of view. There is still the possibility of a sharp decline in the pound.
Both major pairs are moving in a similar way now, but the net position of the euro is positive and even implies the imminent completion of the upward momentum, while the net position of the pound still suggests further growth. The British currency has already risen by more than 2,200 pips, which is a lot, and without a strong downward correction, the continuation of growth would be absolutely illogical. The non-commercial group of traders currently has a total of 58,600 sell contracts and 57,600 buy contracts. I remain skeptical about the long-term growth of the British currency and expect it to decline soon but the market sentiment remains largely bullish.
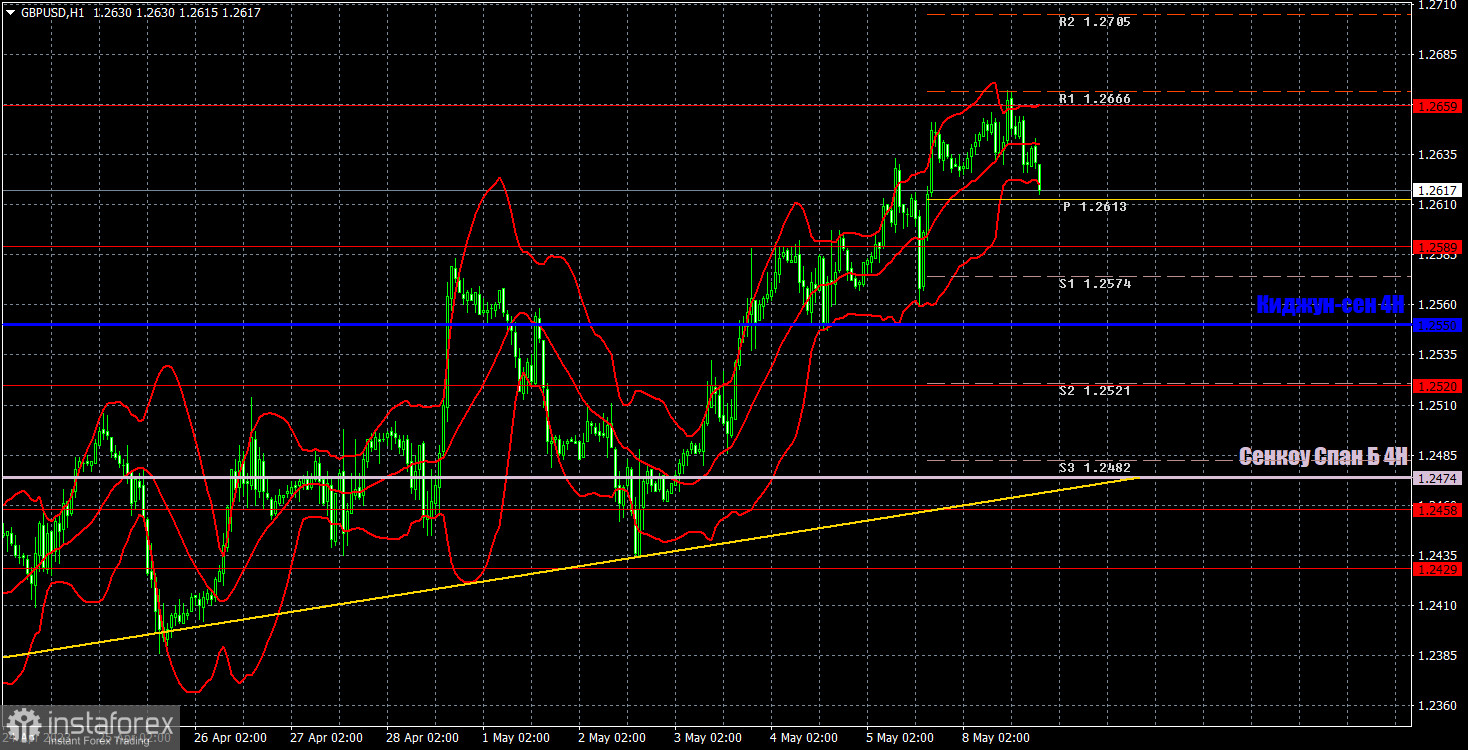
1H chart of GBP/USD
On the 1-hour chart, GBP/USD resumed its upward movement last week and is only aiming for a correction so far. The downward movement may end very quickly, as the market remains bullish. The pound does not need fundamental background support right now, so on Monday we could see a trivial pause, nothing more.
For May 9, we highlight the following important levels: 1.2349, 1.2429-1.2458, 1.2520, 1.2589, 1.2659, 1.2762. Senkou Span B (1.2474) and Kijun-sen (1.2550) lines can also generate signals. Rebounds and breakouts from these lines can also serve as trading signals. It is better to set the Stop Loss at breakeven as soon as the price moves by 20 pips in the right direction. The lines of the Ichimoku indicator can change their position throughout the day which is worth keeping in mind when looking for trading signals. On the chart, you can also see support and resistance levels where you can take profit.
On Tuesday, there are no important publications planned in the UK and the US again. And there are no minor events either. The British pound could well continue to rise even during an uneventful day as it currently needs no serious ground for this, but volatility is unlikely to be high today.
Indicators on charts:
Resistance/support - thick red lines, near which the trend may stop. They do not make trading signals.
Kijun-sen and Senkou Span B are the Ichimoku indicator lines moved to the hourly timeframe from the 4-hour timeframe. They are also strong lines.
Extreme levels are thin red lines, from which the price used to bounce earlier. They can produce trading signals.
Yellow lines are trend lines, trend channels, and any other technical patterns.
Indicator 1 on the COT chart is the size of the net position of each trader category.
Indicator 2 on the COT chart is the size of the net position for the Non-commercial group of traders.