empty
 
 
28.03.2022 10:40 AM
Trading plan for starters of EUR/USD and GBP/USD on March 28, 2022

Details of the economic calendar of March 25

Retail sales in the UK show a slowdown in growth rates from 9.1% to 7.0%.

It is worth considering that the data was published for February, and given the current situation, they are no longer considered informative, since the March figures may turn out to be more deplorable.

Analysis of trading charts from March 25

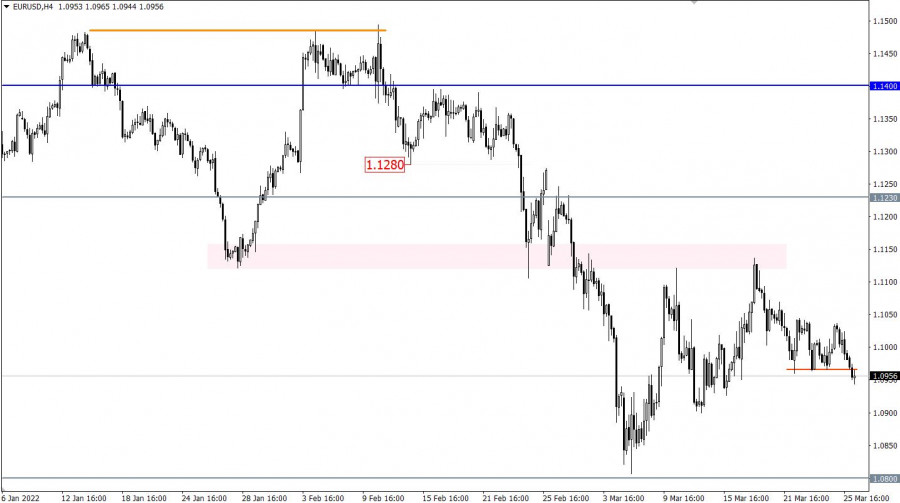
The EURUSD currency pair, after several days of stagnation in the range of 1.0960/1.1050, managed to overcome its lower limit. This led to an increase in the volume of short positions and a restart of the price recovery process relative to a three-week correction.

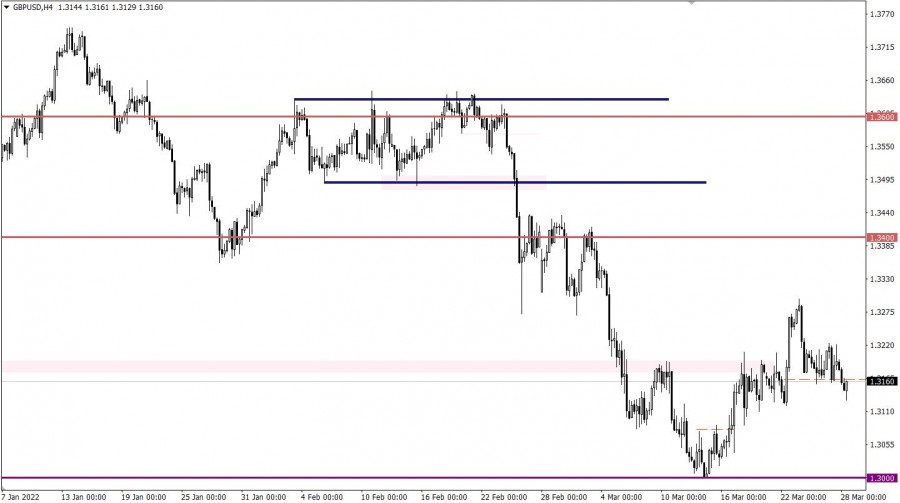
The variable pivot point 1.3175 for the GBPUSD pair was passed by the sellers. This led to an increase in the volume of short positions and keeping the price below 1.3150. As a result of these steps, there was a signal of restoration of dollar positions relative to the recent correction.

This image is no longer relevant

March 28 economic calendar

Monday is traditionally accompanied by an empty macroeconomic calendar. Nevertheless, stable information and news flow will continue to play on the nerves of speculators, which allows for new jumps in the market.

Trading plan for EUR/USD on March 28

In this situation, holding the price stable below 1.0960 in a four-hour period will lead to a phased recovery process. As a guide, market participants consider the values of 1.0900-1.0800.

An alternative market development scenario will be considered by traders if the price returns above 1.1000. In this case, the flat may resume.

This image is no longer relevant

Trading plan for GBP/USD on March 28

Based on a number of technical signals, we can say that the market is dominated by a downward trend. This could lead to further weakening of the pound towards the main level of 1.3000.

This image is no longer relevant

What is reflected in the trading charts?

A candlestick chart view is graphical rectangles of white and black light, with sticks on top and bottom. When analyzing each candle in detail, you will see its characteristics of a relative period: the opening price, closing price, and maximum and minimum prices.

Horizontal levels are price coordinates, relative to which a stop or a price reversal may occur. These levels are called support and resistance in the market.

Circles and rectangles are highlighted examples where the price of the story unfolded. This color selection indicates horizontal lines that may put pressure on the quote in the future.

The up/down arrows are the reference points of the possible price direction in the future.

Gven Podolsky,
انسٹافاریکس کا تجزیاتی ماہر
© 2007-2024
انسٹافاریکس کے ساتھ کرپٹو کرنسی کی معاملاتی تبدیلیوں سے کمائیں۔
میٹا ٹریڈر 4 ڈاؤن لوڈ کریں اور اپنی پہلی ٹریڈ کھولیں۔
  • Grand Choice
    Contest by
    InstaForex
    InstaForex always strives to help you
    fulfill your biggest dreams.
    مقابلہ میں شامل ہوں
  • چانسی ڈیپازٹ
    اپنے اکاؤنٹ میں 3000 ڈالر جمع کروائیں اور حاصل کریں$5000 مزید!
    ہم نومبر قرعہ اندازی کرتے ہیں $5000چانسی ڈیپازٹ نامی مقابلہ کے تحت
    اپنے اکاؤنٹ میں 3000 ڈالر جمع کروانے پر موقع حاصل کریں - اس شرط پر پورا اُترتے ہوئے اس مقابلہ میں شرکت کریں
    مقابلہ میں شامل ہوں
  • ٹریڈ وائز، ون ڈیوائس
    کم از کم 500 ڈالر کے ساتھ اپنے اکاؤنٹ کو ٹاپ اپ کریں، مقابلے کے لیے سائن اپ کریں، اور موبائل ڈیوائسز جیتنے کا موقع حاصل کریں۔
    مقابلہ میں شامل ہوں
  • 100 فیصد بونس
    اپنے ڈپازٹ پر 100 فیصد بونس حاصل کرنے کا آپ کا منفرد موقع
    بونس حاصل کریں
  • 55 فیصد بونس
    اپنے ہر ڈپازٹ پر 55 فیصد بونس کے لیے درخواست دیں
    بونس حاصل کریں
  • 30 فیصد بونس
    ہر بار جب آپ اپنا اکاؤنٹ ٹاپ اپ کریں تو 30 فیصد بونس حاصل کریں
    بونس حاصل کریں

تجویز کردہ مضامین

ابھی فوری بات نہیں کرسکتے ؟
اپنا سوال پوچھیں بذریعہ چیٹ.
Widget callback