Long-term prospect
This week, the euro has nosedived by 300 pips. The currency closed every trading day with a decline. It is a real slump that is perfectly seen on the daily chart. Since the beginning of the downtrend, which has been lasting for 14 months already, a decline that was recorded during the last two weeks has been the most considerable one. The euro and some other currencies are actively losing value amid the current geopolitical situation. In addition, the euro and the pound sterling are riskier assets compared to the US dollar. The better part of international transactions is performed in dollars. If people need to invest funds, they usually choose the greenback. There is no wonder that the US currency is rising. Investors are selling off risky assets and buying the greenback. Analysts have noticed the capital inflow from Russia and Ukraine. People are buying dollars to protect themselves from inflation and devaluation of the Russian ruble. That is why European currencies have no reason to grow. Of course, the US dollar cannot climb for a long time. A correctional process will begin sooner or later. However, at the moment, the downtrend is likely to prevail among the European currencies. We should also remember that while the Fed is planning to raise the benchmark rate, the ECB has no intention to change its policy. It is another factor that is supporting the US dollar.
COT report
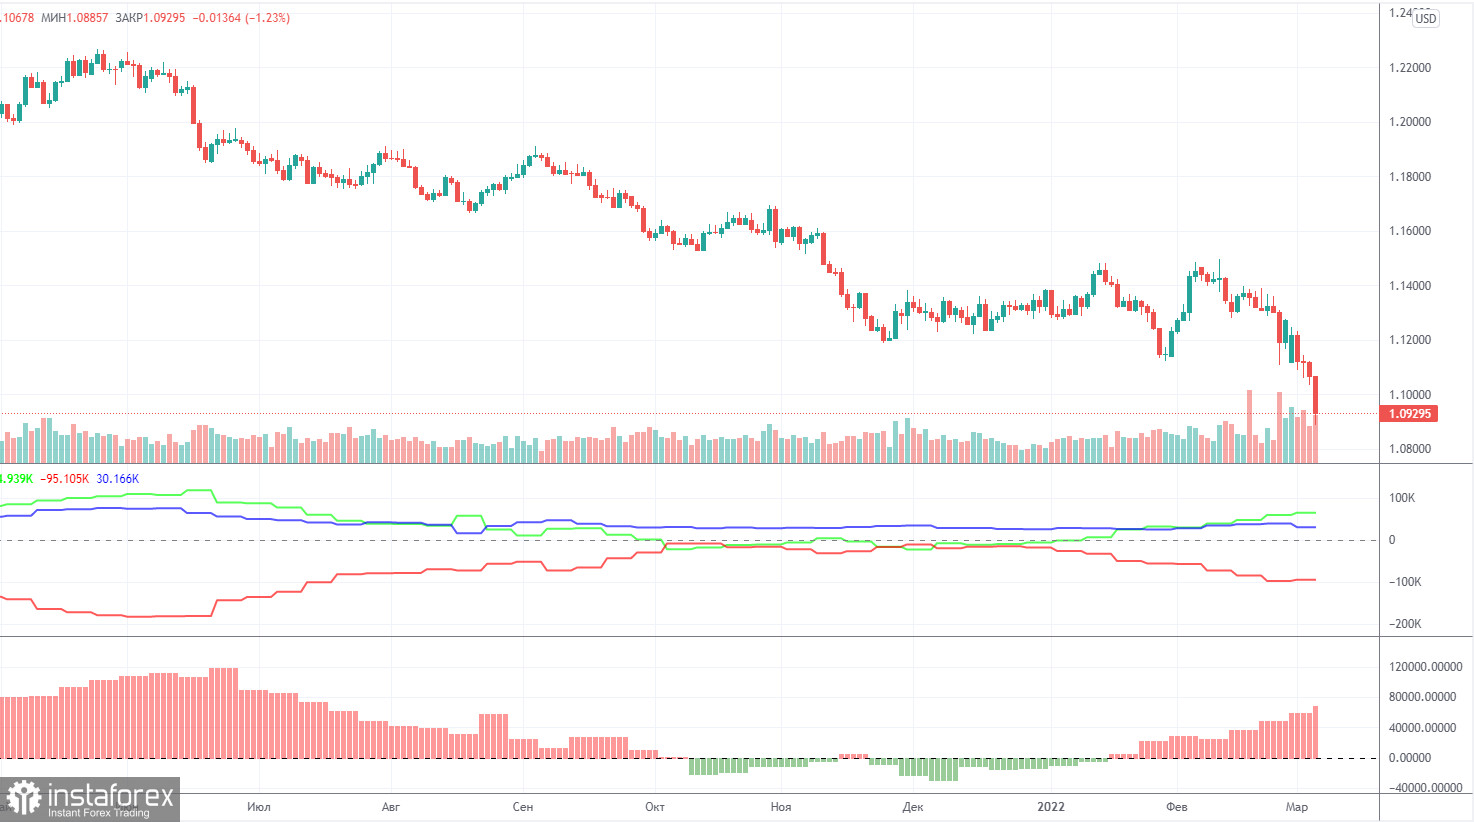
The COT report published on Friday showed a rise in the bullish sentiment among professional traders. This time, non-commercial traders opened about 16K buy positions and 6.8K sell positions. Thus, the overall number of buy contracts exceeds the number of sell contracts by 70K. That is why we can assume that a new bullish trend has started its formation. A decline in the European currencies is the only problem. We can see that demand for the euro is mounting, whereas the currency is losing value. This means that demand for the US dollar is rising faster than demand for the euro. The fact is that now the US dollar is used as a safe-haven asset worldwide. Demand for the greenback is surging amid geopolitical tensions. That is why at present, we cannot use the COT reports to forecast a further movement of the euro/dollar pair. The report does not simply meet the real state of affairs. We have to wait for the end of the conflict in Eastern Europe.
Analysis of fundamental events
This week, there has been a lot of important macroeconomic and fundamental information. However, it failed to influence the market situation. In other words, the euro/dollar pair was moving only in one direction. Notably, the market reacted to some news, thus pushing up the greenback. For example, a strong report on the US non-farm employment change allowed the US dollar to gain in value later on Friday. In addition, Jerome Powell has provided two speeches this week. However, his comments could hardly be called hawkish. This should have pushed the US currency lower. Christine Lagarde also provided several speeches. The US and the EU disclosed their services and manufacturing PMI reports, whereas the EU unveiled its inflation figures for February. Nevertheless, the pair has been falling. Thus, both macroeconomic and fundamental factors have no effect on the market at the moment.
Trading plan for March 7-11.
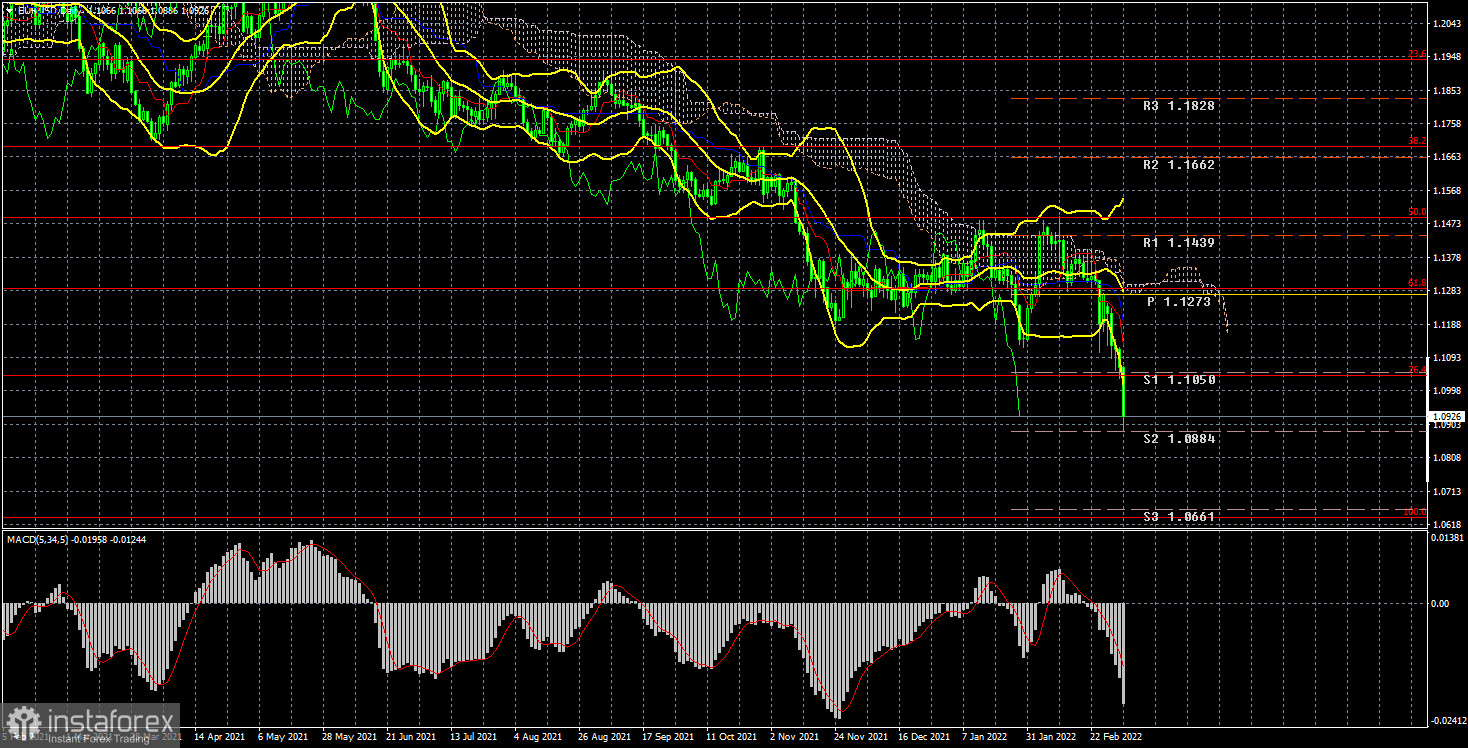
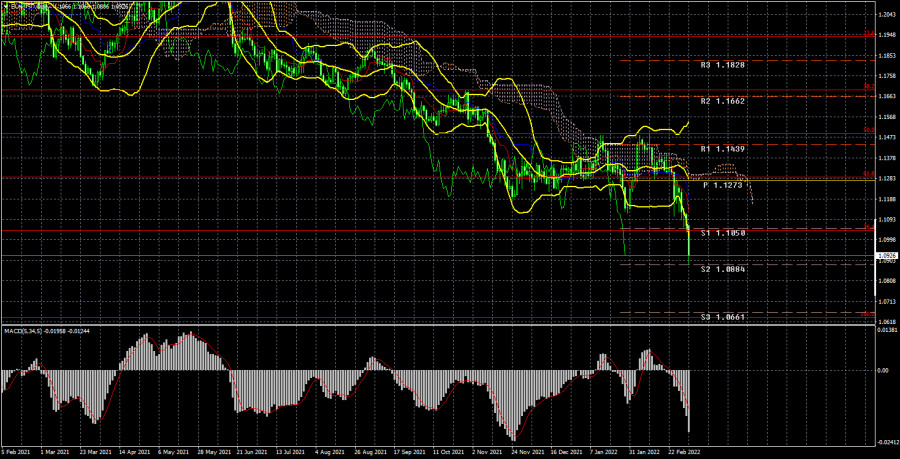
1) On the daily chart, the pair continues losing value amid the current geopolitical situation. By the moment, the pair has passed the 76.4% Fibonacci level. It is likely to hit 1.0637, the 100.0% Fibonacci level.
2) Now, it is not a good idea to buy the euro/dollar pair. Firstly, there are no signs that the pair may begin the upward correction. Secondly, the market is ignoring the macroeconomic data that may support the euro. Thirdly, geopolitical tensions are likely to retain their pressure on traders and investors, who still believe that the US dollar purchases are the only way out.
Description of indicators
Support and resistance levels as well as Fibonacci levels are targeted levels for buy or sell orders. It is possible to set a take-profit order near these levels.
Ichimoku indicators (standard settings), Bollinger Bands (standard settings), MACD (5, 34, 5).
Indicator 1 on the COT charts is the net position size of each category of traders.
Indicator 2 on the COT charts is the net position size for non-commercial traders.