From the point of view of a comprehensive analysis, we see a high activity that led the quote to the recovery process, and now let's talk about the details. Fluctuations of 100-200-300 points are already something common, market participants have updated the historical minimum once again, where the extreme level was the value of 1.1411. In fact, there is nothing surprising here, the external background and panic pressure are putting pressure on the market, which leads to the activation of speculators who are starting to drive the quote on a schedule. At the same time, the quote against the background of historical lows, as well as the external flow formed a conditional range, the boundaries of which were 1.1450 (+/- 35 pip) and 1.1750 (+/- 40 pip).
Regarding the theory of downward development, there is a slight hitch. The lows that the quote has already reached put significant pressure on market participants are literally afraid to go further. This process is temporary in nature and is associated with a significant overheating of past days. In fact, the existing range is trying to rectify the situation with overheating. It is worth considering that if the external background escalates, the pound will be in a hopeless situation, which will lead to a further depreciation. Naturally, this cannot last forever, thereby a thorough analysis of the information flow will help us identify the points of a possible reversal. As you may have guessed from the context, our future topic of discussion is "The Theory of Upward Development".
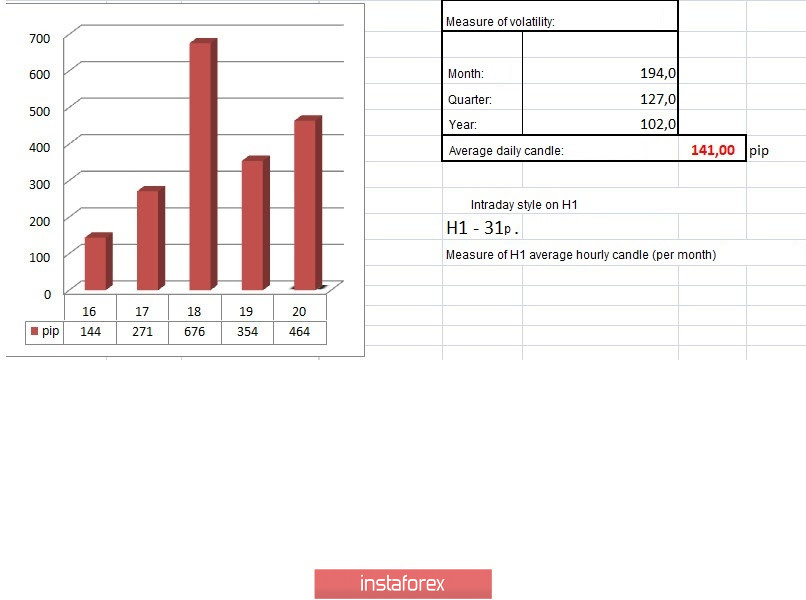
In terms of volatility, we see the indicators that lead speculators to euphoria. In fact, on a daily basis, we are faced with MEGA activity, which not only overcomes the average value, but also beats it in multiple values. At this time, there is no reason to reduce activity, thereby continuing to work at high speeds.
Details of volatility: Monday - 165 points; Tuesday - 245 points; Wednesday - 172 points; Thursday - 358 points; Friday - 359 points; Monday - 144 points; Tuesday - 271 points; Wednesday - 676 points; Thursday - 354 points. The average daily indicator, relative to the dynamics of volatility is 141 points [see table of volatility at the end of the article].
Detailing the day by minute, we see a mirror V-shaped formation, where we recorded an upward surge at first, which locally led us to the 1.1790 region, but after which, there was a reverse gulf, returning the quote to the base point. The most vivid fluctuations came in the period 14:45–16:45, UTC+00 time on the trading terminal.
As discussed in the previous review, medium-term traders actively took profits from short positions, as their transactions were held for a long time, and the main prospect was reached.
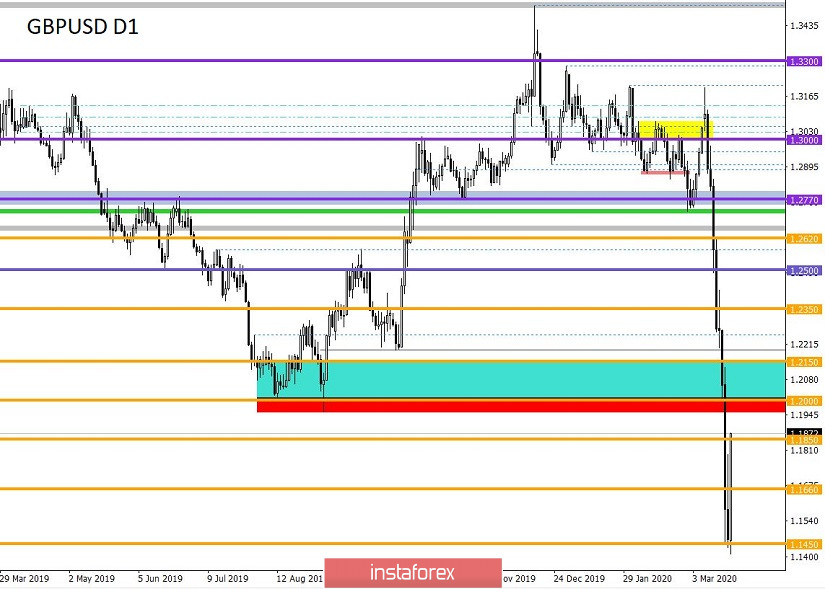
Considering the trading chart in general terms [the daily period], we see that the first rising candle appears on the basis of the impulse downward movement. It is worth considering that for eight consecutive trading days, the quote rapidly declined, having a scale of more than 1600 points.
The news background of the past day contained data on applications for unemployment benefits in the United States, which recorded an increase in applications for 72 thousand. [Primary +70 thousand; repeated +2 thousand]. The data indicate that the situation on the US labor market is not the best.
The main event of the past day was the regular emergency meeting of the Bank of England, during which it was decided to reduce the refinancing rate by 15 basis points to the level of 0.10%. This step was taken by the regulator against the background of a worsening environment for the spread of COVID-19 coronavirus, and measures to contain it will lead to an economic shock that will be acute and widespread. Initially, the London government underestimated the new virus, but after an increase in the number of cases, drastic measures were taken that provoked a panic among the country's population. Epidemiological situation and spread of COVID-19 in Britain as of 05:00 (UTC+00) of 03/20/2020: The total number of infected were 3269, while 627 for the last day; The number of fatal cases is 144.
Today, in terms of the economic calendar, we do not have significant macroeconomic data for Britain and the United States, thereby the main focus will be on the external background, in particular of the developing COVID-19 virus.
The upcoming trading week in terms of statistics has a summary of inflation in Britain, as well as a summary of GDP in the United States. At the same time, the focus will be on meetings of the Bank of England. However, in connection with two emergency meetings where rates were cut, it is not a fact that the planned meeting will take place, as was the case with the Fed. In any case, the external background and worsening of the coronavirus will retain increased activity in the market.
The most interesting events displayed below --->
Tuesday, March 24th
Great Britain 9:30 Universal time - Index of business activity in the Markit services sector (Mar) preliminary
USA 13:45 Universal time - Markit services business activity index (Mar) preliminary
USA 14:00 Universal time - Sales of new homes (m / m) (Feb): Prev 7.9% ---> Prog. 3.7%
Wednesday, March 25
Great Britain 9:30 Universal time - Inflation: Prev 1.8% ---> Prog. 1.6%
USA 12:30 Universal time - Orders for durable goods (Feb)
Thursday, March 26
Great Britain 12:00 Universal time - Bank of England meeting
Great Britain 9:30 Universal time - Retail sales
USA 12:30 Universal time - applications for unemployment benefits
USA 12:30 Universal time - GDP: Prev 2.1%
Further development
Analyzing the current trading chart, we see a rapid recovery relative to the lows, where the quote has already managed to return to the area of 1.1850. In fact, this fluctuation reflects the very technical correction that could not have come. It is worth considering that the external background is still preserved and you should not exclude the possibility of updating the lows in case of escalation of the COVID-19 virus.
From the point of view of the emotional mood of market participants, we see that the panic mood has not disappeared, and the technical correction is filled with speculative activity.
Detailing the available time interval per minute, we see that the lows were updated with the advent of new days, but then the reverse gulf came, which turned the quote by more than 400 points.
In turn, traders are actively working on the recovery process, where positions are local at this time.
Having a general picture of actions, we can assume that the quote is aimed at returning to the area of 1.1950 / 1.2000, where the support point was initially. Whether we should wait for a reverse downward movement is not to be ruled out, but at this time, we are at the recovery stage,and so, it is worth waiting a little.
Based on the above information, we derive trading recommendations:
- Buying positions are already being conducted by traders where fixations are made. The exit point is the level of 1.1850, while the second point is the area of 1.1950 / 1.2000.
- Selling positions are considered in case of finding a resistance point with a subsequent turn. The first option is lower than 1.1790, in the case of working out the level of 1.1850; The second option in the case of preserving the recovery process, where we are considering selling points in the region of the level of 1.2000, is at the stage of slowdown and rebound.
Indicator analysis
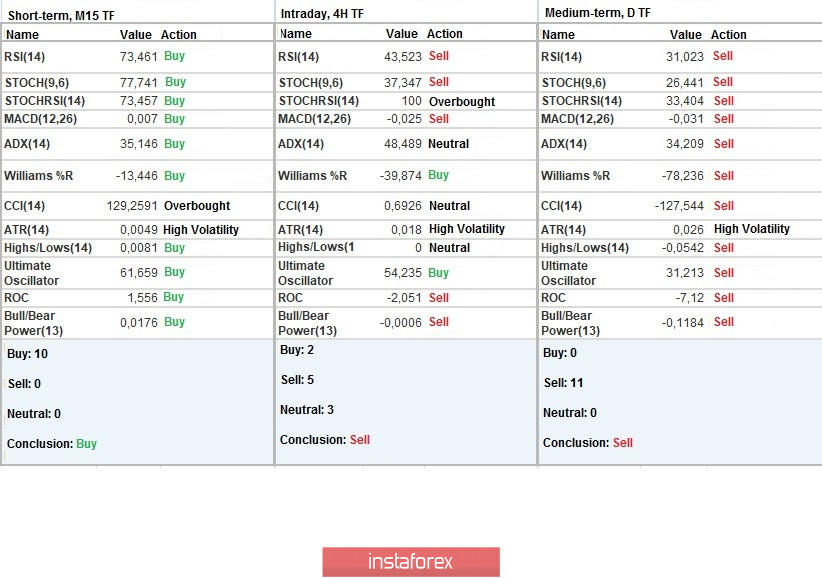
Analyzing a different sector of timeframes (TF), we see that the indicators of technical instruments retain a sell signal relative to hourly and daily periods. At the same time, minute intervals work against the background of jumps.
Volatility per week / Measurement of volatility: Month; Quarter; Year
Measurement of volatility reflects the average daily fluctuation, calculated for the Month / Quarter / Year.
(March 20 was built taking into account the time of publication of the article)
The current time volatility is 464 points, which already exceeds the average daily indicator by 229%. As you know, speculative activity plays with the quote, which gives us high volatility.
Key levels
Resistance Zones: 1.1850; 1.2000 *** (1.1957); 1.2150 **; 1.2350 **; 1.2500; 1.2620; 1.2725 *; 1.2770 **; 1.2885 *; 1.3000; 1.3170 **; 1.3300 **; 1.3600; 1.3850; 1.4000 ***; 1.4350 **.
Support Areas 1.1660; 1.1452; 1.1300; 1,1000; 1,0800; 1,0500; 1,0000.
* Periodic level
** Range Level
*** Psychological level
**** The article is built on the principle of conducting a transaction, with daily adjustment