signal strength 1 of 5

According to the chart of M5, GOLD formed the Bearish Symmetrical Triangle pattern. Description: The lower border is 3314.14/3331.45 and upper border is 3343.45/3331.45. The pattern width is measured on the chart at -2931 pips. The formation of the Bearish Symmetrical Triangle pattern evidently signals a continuation of the downward trend. In other words, if the scenario comes true and GOLD breaches the lower border, the price could continue its move toward 3331.30.
The M5 and M15 time frames may have more false entry points.
- All
- Double Top
- Flag
- Head and Shoulders
- Pennant
- Rectangle
- Triangle
- Triple top
- All
- #AAPL
- #AMZN
- #Bitcoin
- #EBAY
- #FB
- #GOOG
- #INTC
- #KO
- #MA
- #MCD
- #MSFT
- #NTDOY
- #PEP
- #TSLA
- #TWTR
- AUDCAD
- AUDCHF
- AUDJPY
- AUDUSD
- EURCAD
- EURCHF
- EURGBP
- EURJPY
- EURNZD
- EURRUB
- EURUSD
- GBPAUD
- GBPCHF
- GBPJPY
- GBPUSD
- GOLD
- NZDCAD
- NZDCHF
- NZDJPY
- NZDUSD
- SILVER
- USDCAD
- USDCHF
- USDJPY
- USDRUB
- All
- M5
- M15
- M30
- H1
- D1
- All
- Buy
- Sale
- All
- 1
- 2
- 3
- 4
- 5
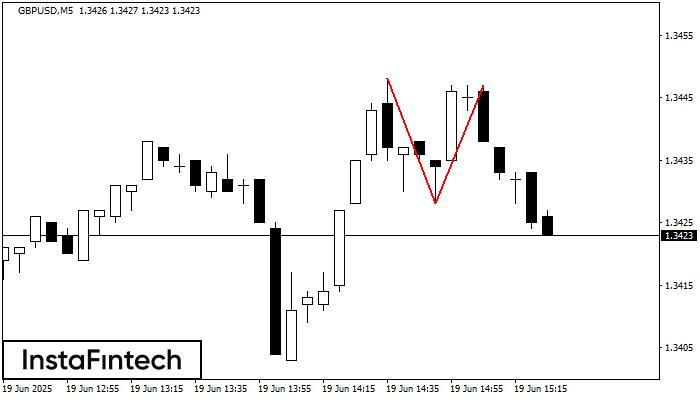
On the chart of GBPUSD M5 the Double Top reversal pattern has been formed. Characteristics: the upper boundary 1.3447; the lower boundary 1.3428; the width of the pattern 19 points
The M5 and M15 time frames may have more false entry points.
Open chart in a new window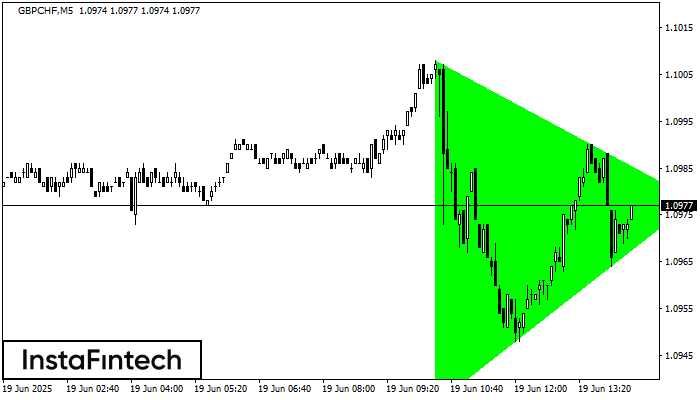
According to the chart of M5, GBPCHF formed the Bullish Symmetrical Triangle pattern. Description: This is the pattern of a trend continuation. 1.1008 and 1.0935 are the coordinates
The M5 and M15 time frames may have more false entry points.
Open chart in a new window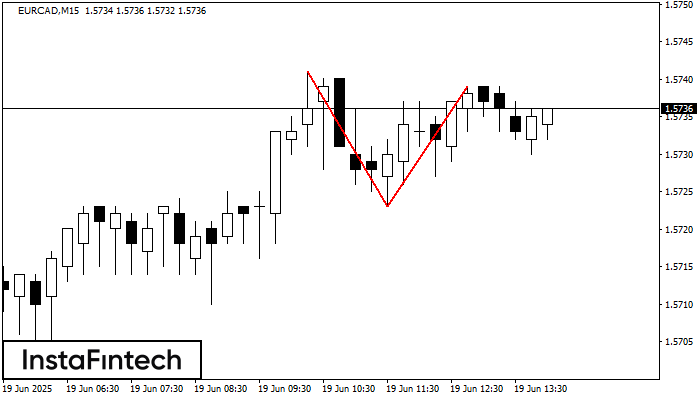
On the chart of EURCAD M15 the Double Top reversal pattern has been formed. Characteristics: the upper boundary 1.5739; the lower boundary 1.5723; the width of the pattern 16 points
The M5 and M15 time frames may have more false entry points.
Open chart in a new window