signal strength 2 of 5
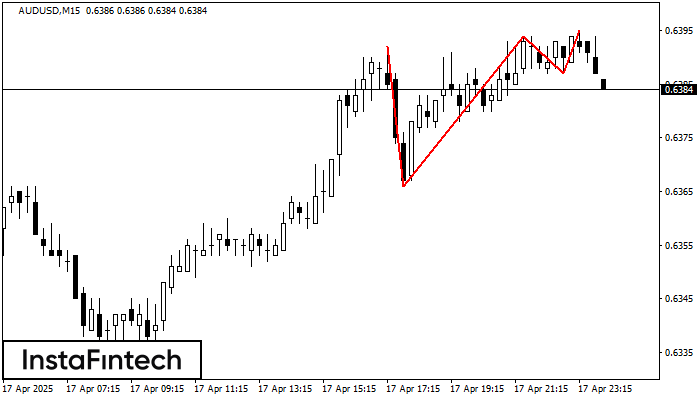
The Triple Top pattern has formed on the chart of the AUDUSD M15 trading instrument. It is a reversal pattern featuring the following characteristics: resistance level -3, support level -21, and pattern’s width 26. Forecast If the price breaks through the support level 0.6366, it is likely to move further down to 0.6371.
The M5 and M15 time frames may have more false entry points.
- All
- Double Top
- Flag
- Head and Shoulders
- Pennant
- Rectangle
- Triangle
- Triple top
- All
- #AAPL
- #AMZN
- #Bitcoin
- #EBAY
- #FB
- #GOOG
- #INTC
- #KO
- #MA
- #MCD
- #MSFT
- #NTDOY
- #PEP
- #TSLA
- #TWTR
- AUDCAD
- AUDCHF
- AUDJPY
- AUDUSD
- EURCAD
- EURCHF
- EURGBP
- EURJPY
- EURNZD
- EURRUB
- EURUSD
- GBPAUD
- GBPCHF
- GBPJPY
- GBPUSD
- GOLD
- NZDCAD
- NZDCHF
- NZDJPY
- NZDUSD
- SILVER
- USDCAD
- USDCHF
- USDJPY
- USDRUB
- All
- M5
- M15
- M30
- H1
- D1
- All
- Buy
- Sale
- All
- 1
- 2
- 3
- 4
- 5
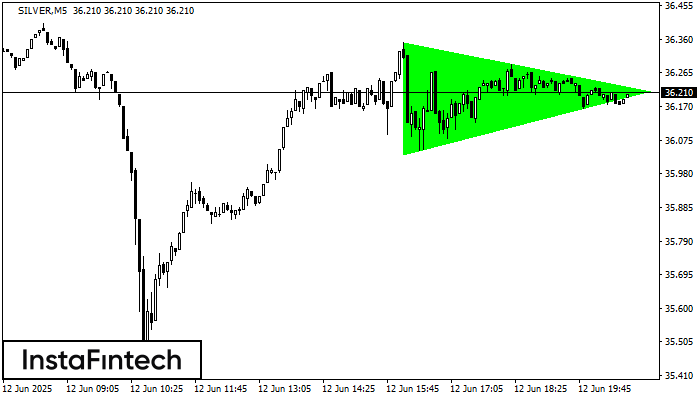
According to the chart of M5, SILVER formed the Bullish Symmetrical Triangle pattern. The lower border of the pattern touches the coordinates 36.03/36.21 whereas the upper border goes across 36.35/36.21
The M5 and M15 time frames may have more false entry points.
Open chart in a new window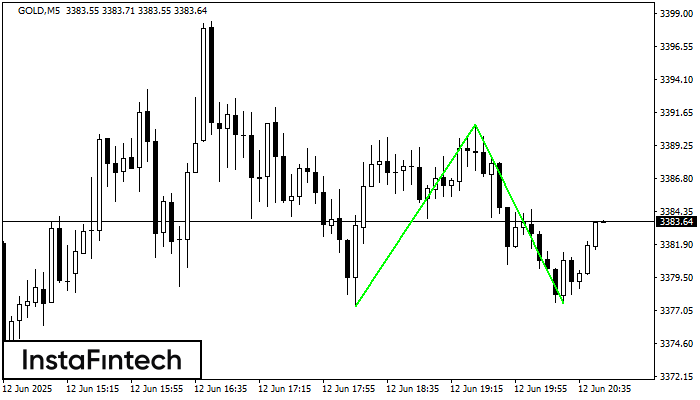
The Double Bottom pattern has been formed on GOLD M5. Characteristics: the support level 3377.38; the resistance level 3390.83; the width of the pattern 1345 points. If the resistance level
The M5 and M15 time frames may have more false entry points.
Open chart in a new window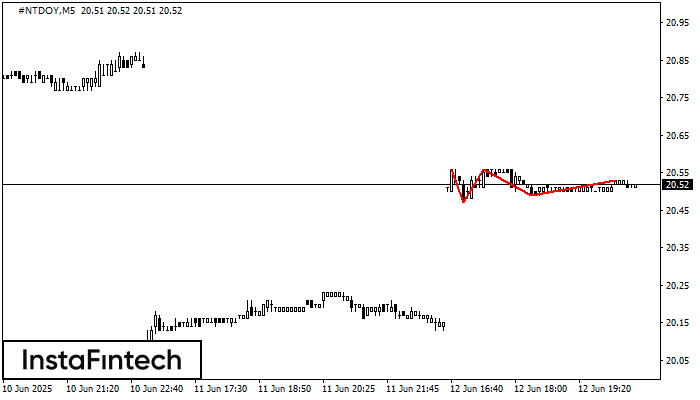
The Triple Top pattern has formed on the chart of the #NTDOY M5 trading instrument. It is a reversal pattern featuring the following characteristics: resistance level 3, support level -2
The M5 and M15 time frames may have more false entry points.
Open chart in a new window