signal strength 1 of 5
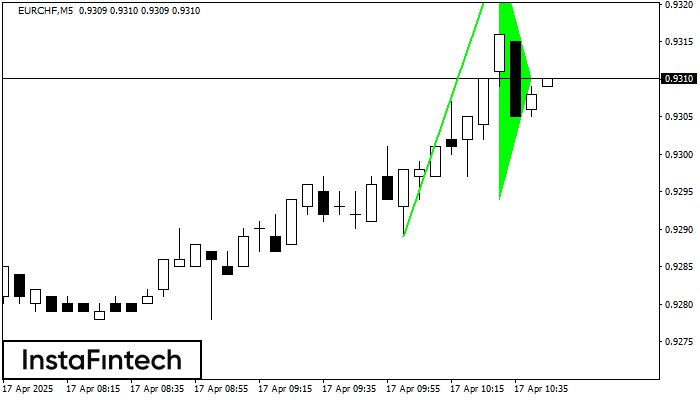
The Bullish pennant pattern is formed on the EURCHF M5 chart. It is a type of the continuation pattern. Supposedly, in case the price is fixed above the pennant’s high of 0.9326, a further uptrend is possible.
The M5 and M15 time frames may have more false entry points.
See Also
- All
- Double Top
- Flag
- Head and Shoulders
- Pennant
- Rectangle
- Triangle
- Triple top
- All
- #AAPL
- #AMZN
- #Bitcoin
- #EBAY
- #FB
- #GOOG
- #INTC
- #KO
- #MA
- #MCD
- #MSFT
- #NTDOY
- #PEP
- #TSLA
- #TWTR
- AUDCAD
- AUDCHF
- AUDJPY
- AUDUSD
- EURCAD
- EURCHF
- EURGBP
- EURJPY
- EURNZD
- EURRUB
- EURUSD
- GBPAUD
- GBPCHF
- GBPJPY
- GBPUSD
- GOLD
- NZDCAD
- NZDCHF
- NZDJPY
- NZDUSD
- SILVER
- USDCAD
- USDCHF
- USDJPY
- USDRUB
- All
- M5
- M15
- M30
- H1
- D1
- All
- Buy
- Sale
- All
- 1
- 2
- 3
- 4
- 5
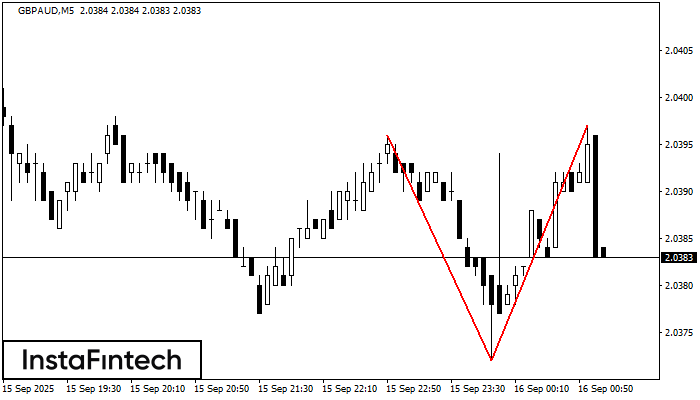
The Double Top pattern has been formed on GBPAUD M5. It signals that the trend has been changed from upwards to downwards. Probably, if the base of the pattern 2.0372
The M5 and M15 time frames may have more false entry points.
Open chart in a new window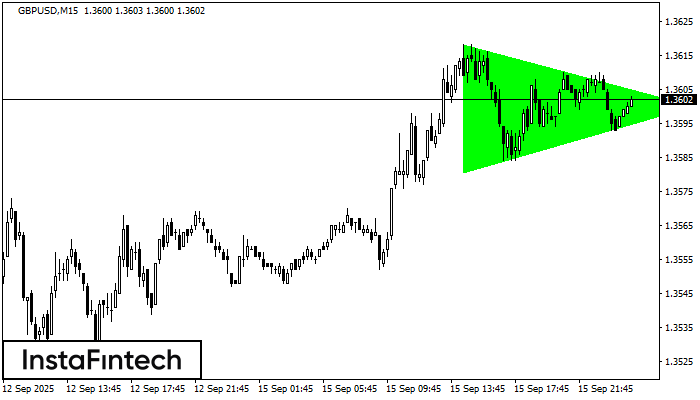
According to the chart of M15, GBPUSD formed the Bullish Symmetrical Triangle pattern, which signals the trend will continue. Description. The upper border of the pattern touches the coordinates 1.3618/1.3600
The M5 and M15 time frames may have more false entry points.
Open chart in a new window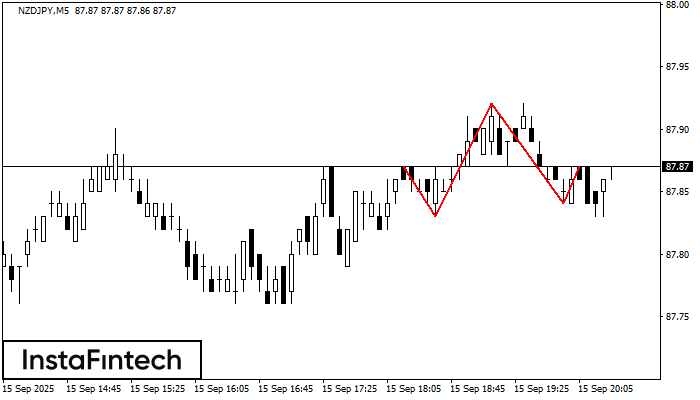
The technical pattern called Head and Shoulders has appeared on the chart of NZDJPY M5. There are weighty reasons to suggest that the price will surpass the Neckline 87.83/87.84 after
The M5 and M15 time frames may have more false entry points.
Open chart in a new window