signal strength 1 of 5
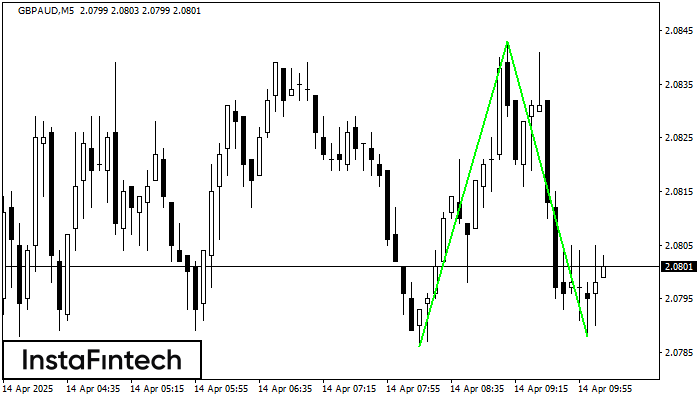
The Double Bottom pattern has been formed on GBPAUD M5. Characteristics: the support level 2.0786; the resistance level 2.0843; the width of the pattern 57 points. If the resistance level is broken, a change in the trend can be predicted with the first target point lying at the distance of 55 points.
The M5 and M15 time frames may have more false entry points.
- All
- Double Top
- Flag
- Head and Shoulders
- Pennant
- Rectangle
- Triangle
- Triple top
- All
- #AAPL
- #AMZN
- #Bitcoin
- #EBAY
- #FB
- #GOOG
- #INTC
- #KO
- #MA
- #MCD
- #MSFT
- #NTDOY
- #PEP
- #TSLA
- #TWTR
- AUDCAD
- AUDCHF
- AUDJPY
- AUDUSD
- EURCAD
- EURCHF
- EURGBP
- EURJPY
- EURNZD
- EURRUB
- EURUSD
- GBPAUD
- GBPCHF
- GBPJPY
- GBPUSD
- GOLD
- NZDCAD
- NZDCHF
- NZDJPY
- NZDUSD
- SILVER
- USDCAD
- USDCHF
- USDJPY
- USDRUB
- All
- M5
- M15
- M30
- H1
- D1
- All
- Buy
- Sale
- All
- 1
- 2
- 3
- 4
- 5
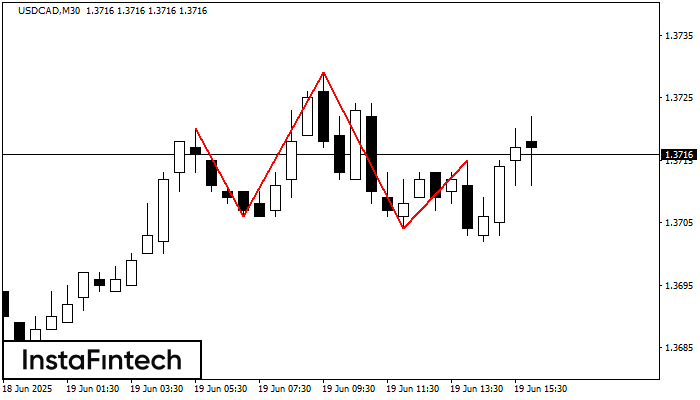
The USDCAD M30 formed the Head and Shoulders pattern with the following features: The Head’s top is at 1.3729, the Neckline and the upward angle are at 1.3706/1.3704. The formation
Open chart in a new window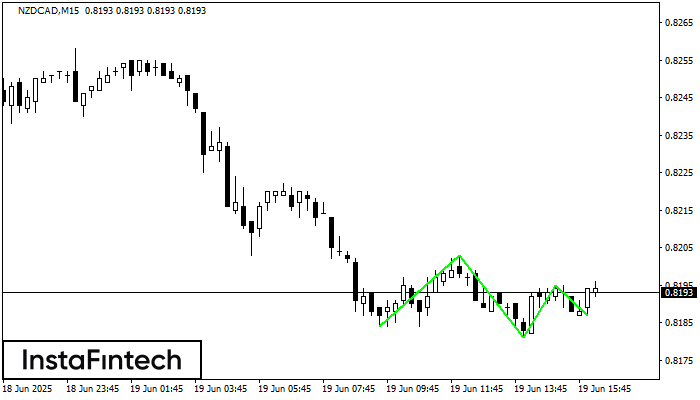
The Triple Bottom pattern has formed on the chart of the NZDCAD M15 trading instrument. The pattern signals a change in the trend from downwards to upwards in the case
The M5 and M15 time frames may have more false entry points.
Open chart in a new window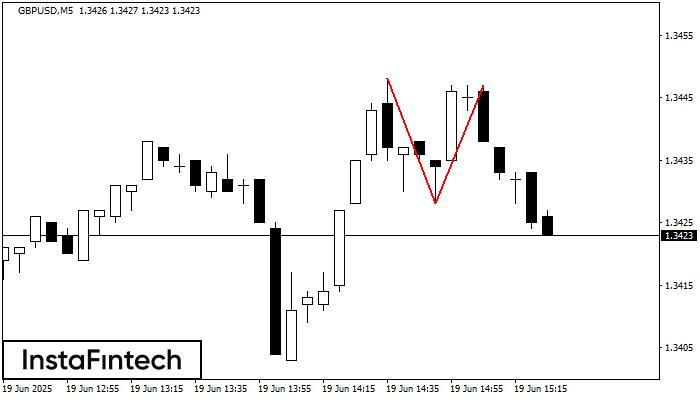
On the chart of GBPUSD M5 the Double Top reversal pattern has been formed. Characteristics: the upper boundary 1.3447; the lower boundary 1.3428; the width of the pattern 19 points
The M5 and M15 time frames may have more false entry points.
Open chart in a new window