signal strength 4 of 5
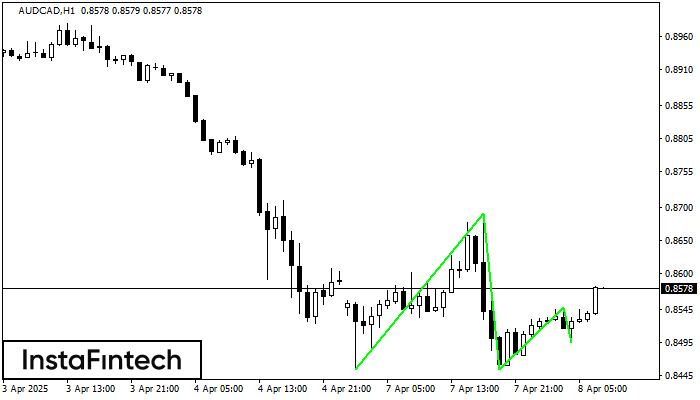
The Triple Bottom pattern has been formed on AUDCAD H1. It has the following characteristics: resistance level 0.8692/0.8549; support level 0.8454/0.8496; the width is 238 points. In the event of a breakdown of the resistance level of 0.8692, the price is likely to continue an upward movement at least to 0.8495.
- All
- Double Top
- Flag
- Head and Shoulders
- Pennant
- Rectangle
- Triangle
- Triple top
- All
- #AAPL
- #AMZN
- #Bitcoin
- #EBAY
- #FB
- #GOOG
- #INTC
- #KO
- #MA
- #MCD
- #MSFT
- #NTDOY
- #PEP
- #TSLA
- #TWTR
- AUDCAD
- AUDCHF
- AUDJPY
- AUDUSD
- EURCAD
- EURCHF
- EURGBP
- EURJPY
- EURNZD
- EURRUB
- EURUSD
- GBPAUD
- GBPCHF
- GBPJPY
- GBPUSD
- GOLD
- NZDCAD
- NZDCHF
- NZDJPY
- NZDUSD
- SILVER
- USDCAD
- USDCHF
- USDJPY
- USDRUB
- All
- M5
- M15
- M30
- H1
- D1
- All
- Buy
- Sale
- All
- 1
- 2
- 3
- 4
- 5
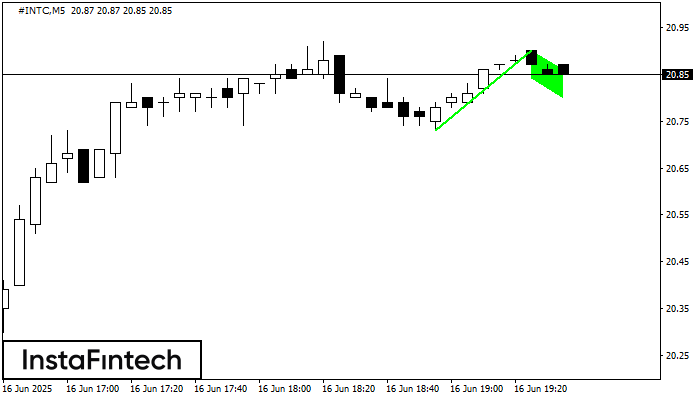
The Bullish Flag pattern has been formed on the chart #INTC M5 which signals that the upward trend will continue. Signals: а break of the peak at 20.90 may push
The M5 and M15 time frames may have more false entry points.
Open chart in a new window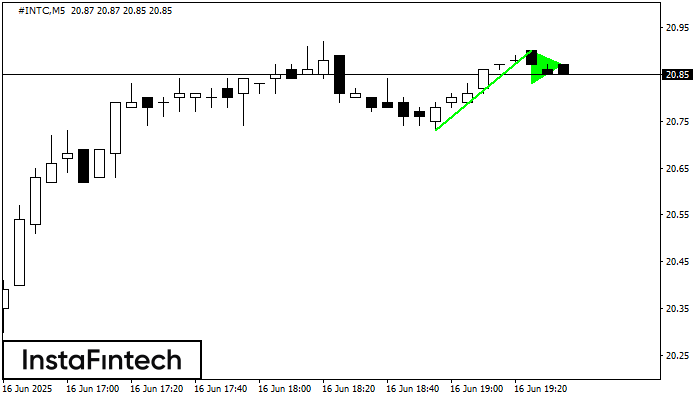
The Bullish pennant pattern is formed on the #INTC M5 chart. It is a type of the continuation pattern. Supposedly, in case the price is fixed above the pennant’s high
The M5 and M15 time frames may have more false entry points.
Open chart in a new window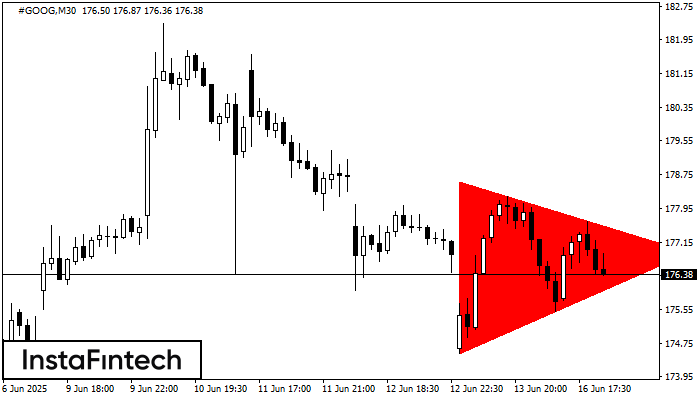
According to the chart of M30, #GOOG formed the Bearish Symmetrical Triangle pattern. Description: The lower border is 174.50/176.90 and upper border is 178.59/176.90. The pattern width is measured
Open chart in a new window