

signal strength 3 of 5
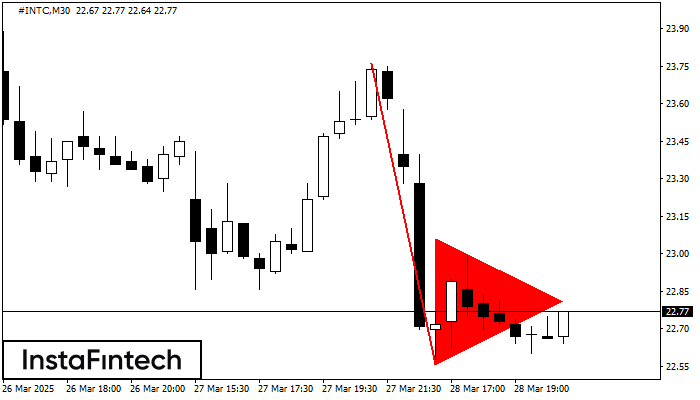
The Bearish pennant pattern has formed on the #INTC M30 chart. This pattern type is characterized by a slight slowdown after which the price will move in the direction of the original trend. In case the price fixes below the pattern’s low of 22.56, a trader will be able to successfully enter the sell position.
See Also
- All
- Double Top
- Flag
- Head and Shoulders
- Pennant
- Rectangle
- Triangle
- Triple top
- All
- #AAPL
- #AMZN
- #Bitcoin
- #EBAY
- #FB
- #GOOG
- #INTC
- #KO
- #MA
- #MCD
- #MSFT
- #NTDOY
- #PEP
- #TSLA
- #TWTR
- AUDCAD
- AUDCHF
- AUDJPY
- AUDUSD
- EURCAD
- EURCHF
- EURGBP
- EURJPY
- EURNZD
- EURRUB
- EURUSD
- GBPAUD
- GBPCHF
- GBPJPY
- GBPUSD
- GOLD
- NZDCAD
- NZDCHF
- NZDJPY
- NZDUSD
- SILVER
- USDCAD
- USDCHF
- USDJPY
- USDRUB
- All
- M5
- M15
- M30
- H1
- D1
- All
- Buy
- Sale
- All
- 1
- 2
- 3
- 4
- 5
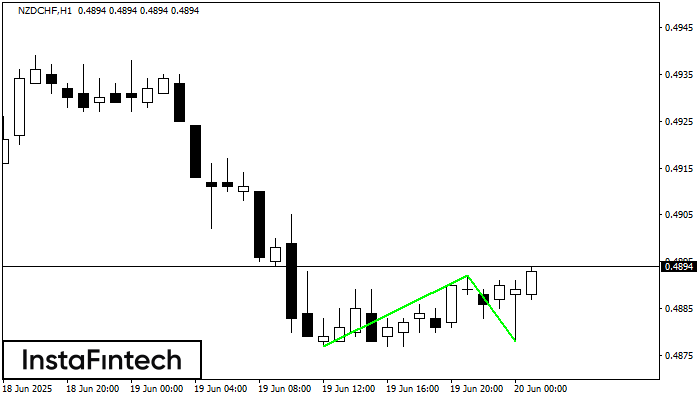
The Double Bottom pattern has been formed on NZDCHF H1. Characteristics: the support level 0.4877; the resistance level 0.4892; the width of the pattern 15 points. If the resistance level
Open chart in a new window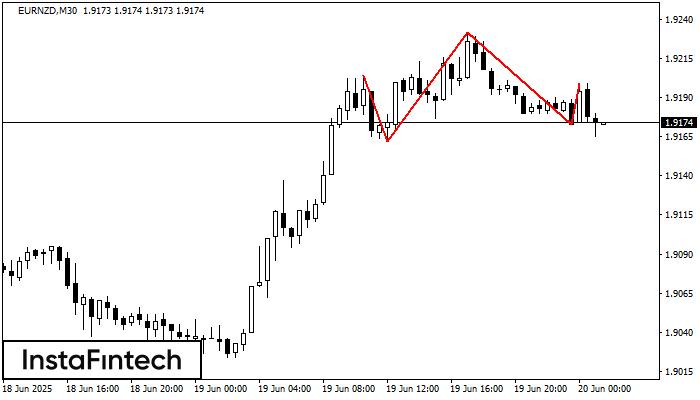
The technical pattern called Head and Shoulders has appeared on the chart of EURNZD M30. There are weighty reasons to suggest that the price will surpass the Neckline 1.9162/1.9173 after
Open chart in a new window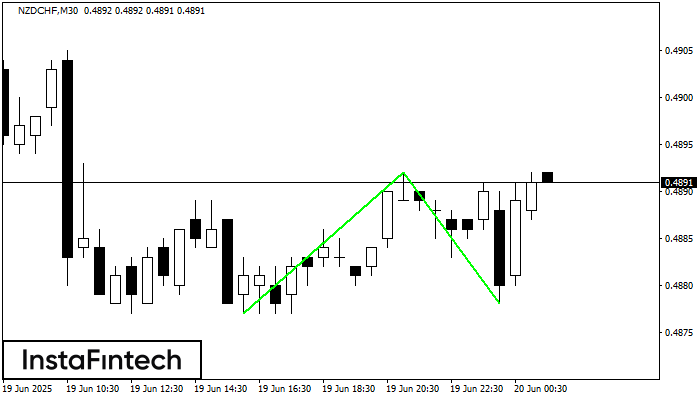
The Double Bottom pattern has been formed on NZDCHF M30; the upper boundary is 0.4892; the lower boundary is 0.4878. The width of the pattern is 15 points. In case
Open chart in a new window


