signal strength 1 of 5
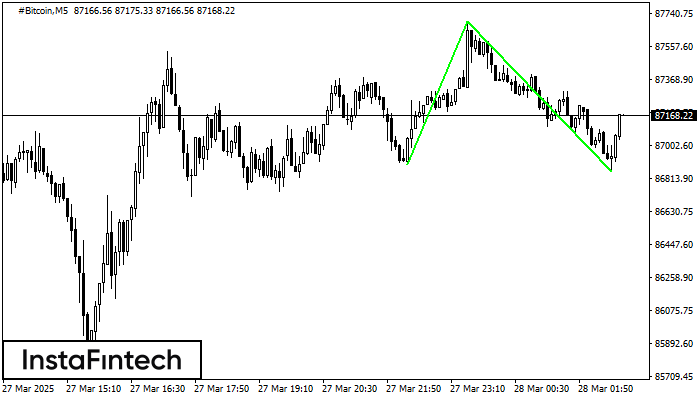
The Double Bottom pattern has been formed on #Bitcoin M5. Characteristics: the support level 86893.54; the resistance level 87696.01; the width of the pattern 80247 points. If the resistance level is broken, a change in the trend can be predicted with the first target point lying at the distance of 84049 points.
The M5 and M15 time frames may have more false entry points.
See Also
- All
- Double Top
- Flag
- Head and Shoulders
- Pennant
- Rectangle
- Triangle
- Triple top
- All
- #AAPL
- #AMZN
- #Bitcoin
- #EBAY
- #FB
- #GOOG
- #INTC
- #KO
- #MA
- #MCD
- #MSFT
- #NTDOY
- #PEP
- #TSLA
- #TWTR
- AUDCAD
- AUDCHF
- AUDJPY
- AUDUSD
- EURCAD
- EURCHF
- EURGBP
- EURJPY
- EURNZD
- EURRUB
- EURUSD
- GBPAUD
- GBPCHF
- GBPJPY
- GBPUSD
- GOLD
- NZDCAD
- NZDCHF
- NZDJPY
- NZDUSD
- SILVER
- USDCAD
- USDCHF
- USDJPY
- USDRUB
- All
- M5
- M15
- M30
- H1
- D1
- All
- Buy
- Sale
- All
- 1
- 2
- 3
- 4
- 5
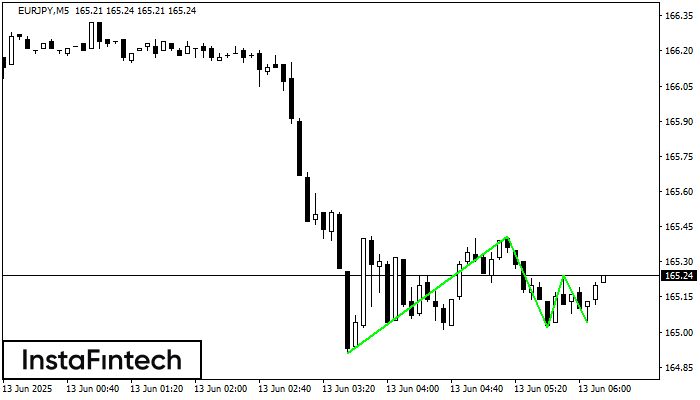
The Triple Bottom pattern has formed on the chart of EURJPY M5. Features of the pattern: The lower line of the pattern has coordinates 165.41 with the upper limit 165.41/165.24
The M5 and M15 time frames may have more false entry points.
Open chart in a new window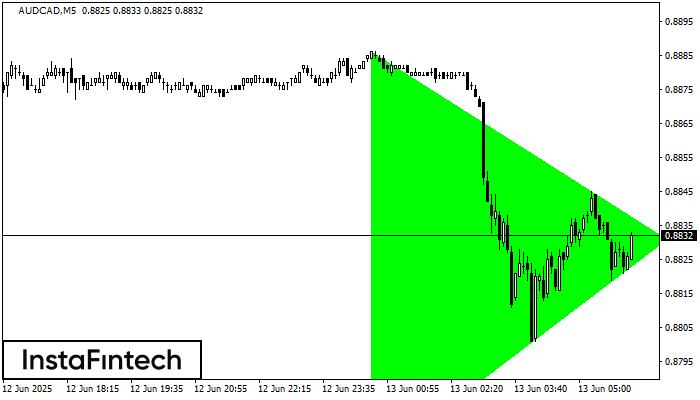
According to the chart of M5, AUDCAD formed the Bullish Symmetrical Triangle pattern, which signals the trend will continue. Description. The upper border of the pattern touches the coordinates 0.8886/0.8831
The M5 and M15 time frames may have more false entry points.
Open chart in a new window
The Double Bottom pattern has been formed on GBPJPY M5; the upper boundary is 194.31; the lower boundary is 193.76. The width of the pattern is 58 points. In case
The M5 and M15 time frames may have more false entry points.
Open chart in a new window