signal strength 2 of 5
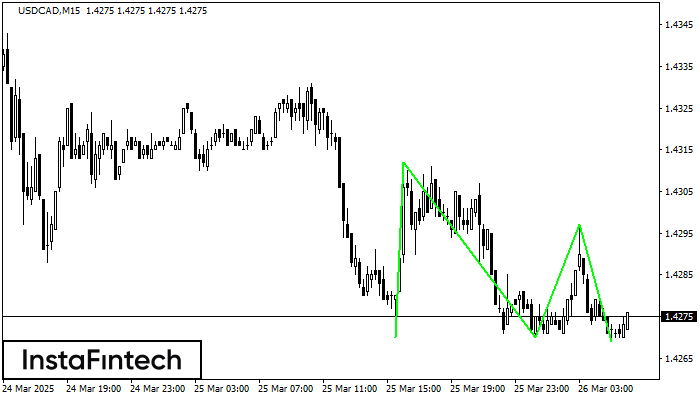
The Triple Bottom pattern has formed on the chart of USDCAD M15. Features of the pattern: The lower line of the pattern has coordinates 1.4312 with the upper limit 1.4312/1.4297, the projection of the width is 42 points. The formation of the Triple Bottom pattern most likely indicates a change in the trend from downward to upward. This means that in the event of a breakdown of the resistance level 1.4270, the price is most likely to continue the upward movement.
The M5 and M15 time frames may have more false entry points.
Juga lihat
- All
- Double Top
- Flag
- Head and Shoulders
- Pennant
- Rectangle
- Triangle
- Triple top
- All
- #AAPL
- #AMZN
- #Bitcoin
- #EBAY
- #FB
- #GOOG
- #INTC
- #KO
- #MA
- #MCD
- #MSFT
- #NTDOY
- #PEP
- #TSLA
- #TWTR
- AUDCAD
- AUDCHF
- AUDJPY
- AUDUSD
- EURCAD
- EURCHF
- EURGBP
- EURJPY
- EURNZD
- EURRUB
- EURUSD
- GBPAUD
- GBPCHF
- GBPJPY
- GBPUSD
- GOLD
- NZDCAD
- NZDCHF
- NZDJPY
- NZDUSD
- SILVER
- USDCAD
- USDCHF
- USDJPY
- USDRUB
- All
- M5
- M15
- M30
- H1
- D1
- All
- Buy
- Sale
- All
- 1
- 2
- 3
- 4
- 5
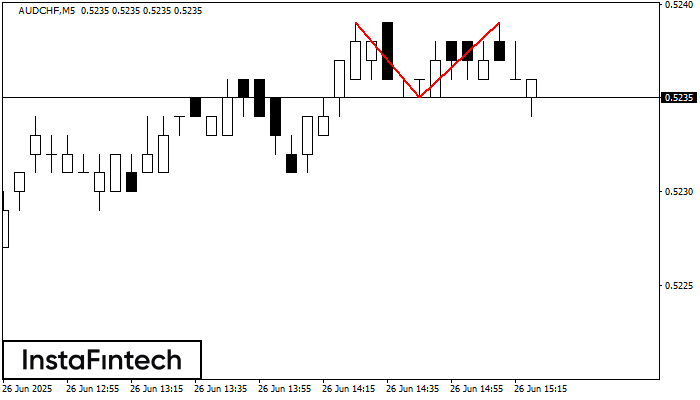
Corak Double Top telah dibentuk pada AUDCHF M5. Isyarat bahawa aliran telah berubah dari aliran menaik ke aliran menurun. Mungkin, sekiranya asas corak 0.5235 ditembusi, pergerakan menurun akan berterusan
Carta masa M5 dan M15 mungkin mempunyai lebih banyak titik kemasukan palsu.
Open chart in a new window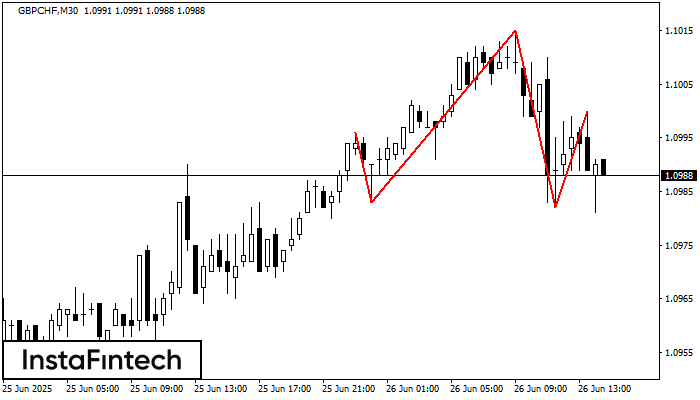
GBPCHF M30 membentuk corak Head dan Shoulders dengan ciri-ciri berikut: Bahagian atas Head adalah 1.1015, garisan Neck dan sudut menaik berada pada 1.0983/1.0982. Pembentukan corak ini boleh membawa perubahan dalam
Open chart in a new window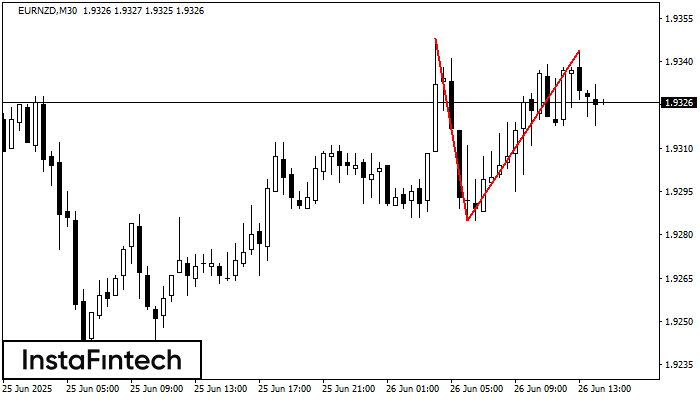
Pada carta EURNZD M30 corak pembalikan Double Top telah terbentuk. Ciri-ciri: sempadan atas 1.9344; sempadan bawah 1.9285; lebar corak 59 mata. Isyarat: penembusan sempadan bawah akan menyebabkan kesinambungan arah aliran
Open chart in a new window