empty
04.09.2024 12:40 PM
EUR/USD. September 4. U.S. Economy Faces Challenges Again

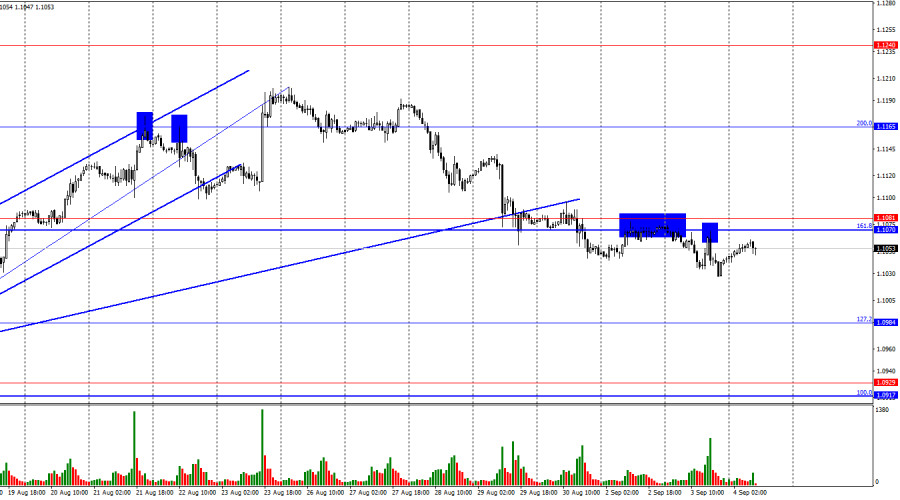
On Tuesday, the EUR/USD pair once again rebounded from the 161.8% corrective level at 1.1070, leading to a reversal in favor of the U.S. dollar. Currently, the pair is heading towards the 1.1070 level again. A third rebound from the 1.1070–1.1081 zone could signal a continued decline towards the 127.2% Fibonacci level at 1.0984. If the pair consolidates above the 1.1070–1.1081 zone, we could see some growth towards the 200.0% corrective level at 1.1165.

This image is no longer relevant

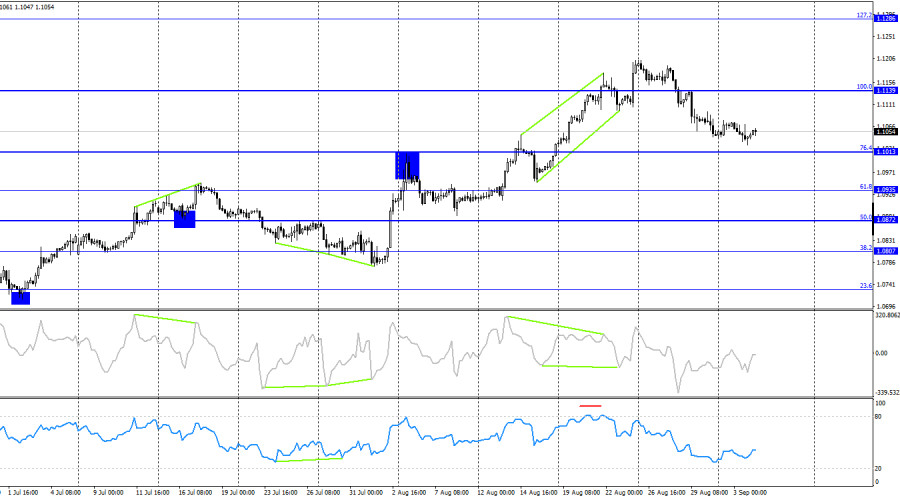
The wave structure has become a bit more complex, but it remains generally clear. The last completed upward wave broke the peak of the previous wave, while the new downward wave hasn't yet approached the last low from August 15. Thus, the current trend remains bullish. For this trend to reverse, bears would now need to break the low of the most recent downward wave, which is near the 1.0950 level.

Tuesday's news once again brought no significant support for the U.S. dollar. The ISM Manufacturing Index performed better than last month, but the S&P Manufacturing Index showed a decline from 49.6 to 47.9. As a result, Tuesday's news cannot be considered a positive for the dollar. Throughout the day, bears made several attempts to apply pressure on the pair, but these efforts were weak and lacked conviction. As I mentioned earlier, this week's developments will heavily depend on the news flow. So far, there has been little news, and it has allowed the dollar to maintain its recently gained positions. However, the first weak report could trigger a revival of the bulls. Today, the JOLTS report might be that trigger. If the number of job openings falls below expectations, we may see consolidation above the 1.1070–1.1081 zone. The market still expects aggressive rate cuts from the Federal Reserve by the end of the year, which remains a key risk factor for the U.S. dollar.

This image is no longer relevant

On the 4-hour chart, the pair has consolidated below the 100.0% Fibonacci level at 1.1139. This suggests a potential decline in the euro towards the 76.4% corrective level at 1.1013. A rebound from the 1.1013 level could signal a reversal in favor of the euro and some growth towards 1.1139. Currently, no divergences are observed in any indicators.

Commitments of Traders (COT) Report:

This image is no longer relevant

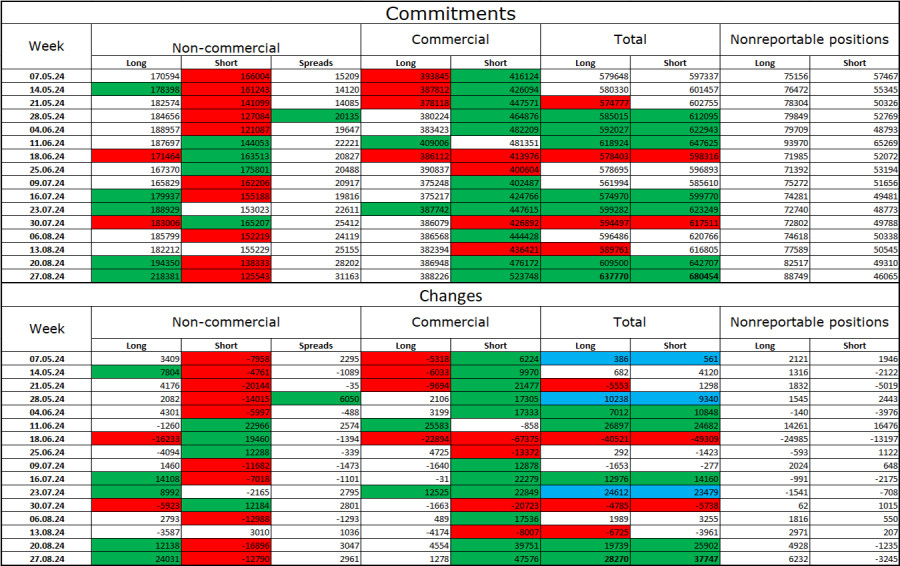
In the latest reporting week, speculators opened 24,031 long positions and closed 12,790 short positions. The sentiment of the "Non-commercial" group turned bearish several months ago, but bulls are actively dominating at the moment. The total number of long positions held by speculators is now 218,000, while the number of short positions is 125,000.

I still believe the situation will continue to shift in favor of the bears. I see no long-term reasons to buy the euro. It's also worth noting that the market has already priced in a 100% chance of a rate cut by the FOMC in September. The likelihood of a euro decline remains significant. However, we must not forget about technical analysis, which currently doesn't indicate a sharp euro decline, nor the news background, which regularly throws obstacles in the dollar's path.

U.S. and Eurozone News Calendar:

  • Eurozone – German Services PMI (07:55 UTC)
  • Eurozone – Services PMI (08:00 UTC)
  • U.S. – JOLTS Job Openings (14:00 UTC)

The September 4 economic calendar contains three key events. The news impact on market sentiment in the second half of the day could be moderate.

Forecast for EUR/USD and Trader Recommendations:

Selling the pair could be considered after a rebound from the 1.1070–1.1081 zone, targeting 1.0984. These trades can still be held open. Buying will be possible if the pair closes above the 1.1070–1.1081 zone on the hourly chart, targeting 1.1165.

The Fibonacci levels are based on the 1.0917–1.0668 range on the hourly chart and 1.1139–1.0603 on the 4-hour chart.

Pilih carta masa
5
min
15
min
30
min
1
jam
4
jam
1
hari
1
minggu
Jana pendapatan melalui perubahan kadar mata wang kripto dengan InstaForex.
Muat turun MetaTrader 4 dan buka dagangan pertama anda.
  • Grand Choice
    Contest by
    InstaForex
    InstaForex always strives to help you
    fulfill your biggest dreams.
    SERTAI PERADUAN

Artikel yang dicadangkan

Isyarat Dagangan untuk XAU/USD bagi 20-23 Januari 2025: beli di atas $2,700 (21 SMA - 6/8 Murray)

Pada awal sesi dagangan Amerika, emas didagangkan sekitar 2,709 melantun selepas mencecah paras terendah pada 2,690. Kemungkinan ia akan terus meningkat dalam beberapa jam akan datang sehingga mencapai puncak saluran

Dimitrios Zappas 16:15 2025-01-20 UTC+2

Analisis Teknikal Pergerakan Harga Harian Pasangan Mata Wang Eksotik USD/IDR, Isnin 20 Januari 2025.

Dengan kemunculan corak Rising Wedge dan Divergence antara pergerakan harga pasangan matawang eksotik USD/IDR dengan penunjuk RSI (5), ia mengesahkan potensi pembetulan kelemahan dalam matawang ini, di mana selagi tiada

Arief Makmur 05:22 2025-01-20 UTC+2

Analisis Teknikal Pergerakan Harga Harian Instrumen Komoditi Minyak Mentah, Isnin 20 Januari 2025.

Pada carta harian, instrumen komoditi Minyak Mentah (CL) menunjukkan bahawa selepas berjaya menembusi corak Failing Wedge, muncul perbezaan antara pergerakan harga #CL dan penunjuk Pengayun Stochastic. Ini menunjukkan bahawa walaupun

Arief Makmur 05:22 2025-01-20 UTC+2

Ramalan untuk EUR/USD pada 20 Januari 2025

Hari ini, euro mula didagangkan dalam julat yang ditetapkan pada 15 Januari, di mana ia kekal sepanjang minggu lepas. Perhatian pasaran sangat tertumpu pada perasmian Donald Trump. Jika perkembangan politik

Laurie Bailey 03:52 2025-01-20 UTC+2

Ramalan untuk GBP/USD pada 20 Januari 2025

Penurunan nilai pound pada hari Jumaat adalah berbeza secara signifikan daripada pergerakan dalam empat sesi sebelumnya. Hari tersebut ditutup dengan graf lilin hitam yang ketara di bawah tahap sokongan 1.2186

Laurie Bailey 03:52 2025-01-20 UTC+2

Ramalan untuk USD/JPY pada 20 Januari 2025

Pada hari Jumaat, pasangan USD/JPY melantun semula dari sokongan garisan MACD, menandakan pembetulan selepas penurunan selama dua hari. Garisan isyarat pengayun Marlin berpatah balik ke bawah dari garisan sifar neutral

Laurie Bailey 03:52 2025-01-20 UTC+2

Bitcoin – Analisis Teknikal

Pada tahun lalu, pergerakan menaik jelas menguasai keadaan, mencapai kelebihan dan pencapaian signifikan. Pada tahun 2024, mereka mencapai tahap tertinggi sepanjang masa yang baharu iaitu AS$108,362.36, mengatasi puncak sebelumnya AS$68,959.73

Evangelos Poulakis 03:20 2025-01-20 UTC+2

USD/JPY dan EUR/JPY – Tinjauan Analisis Teknikal

Pada penghujung minggu lalu, kami memerhatikan pengukuhan mingguan, yang mengakibatkan bayang bawah yang panjang mencapai sempadan awan Ichimoku mingguan pada 156.07. Penjual mungkin kini berusaha untuk mengekalkan inisiatif yang diperlukan

Evangelos Poulakis 00:12 2025-01-20 UTC+2

Isyarat Dagangan untuk EUR/USD bagi 16-19 Januari 2025: beli melebihi 1.0290 (21 SMA - 4/8 Murray)

Kuncinya adalah untuk tetap waspada. Jika pasangan EUR/USD berjaya untuk mengukuh di atas 200 EMA, kita dapat menjangkakan perubahan aliran agar euro dapat meneruskan kenaikan sehingga mencapai kawasan 1.0742 (8/8

Dimitrios Zappas 13:57 2025-01-17 UTC+2

Isyarat Dagangan EMAS (XAU/USD) untuk 17-21 Januari 2025: jual di bawah AS$2,725 (terlebih beli- 6/8 Murray)

Pada awal sesi dagangan Amerika, emas didagangkan sekitar 2,709 dalam saluran aliran menaik yang terbentuk sejak 26 Disember, menghampiri zon rintangan dan menunjukkan tanda-tanda keletihan yang berkemungkinan menyebabkan pembetulan teknikal

Dimitrios Zappas 13:56 2025-01-17 UTC+2
Tidak boleh bertanya sekarang?
Tanya soalan anda di Ruangan bersembang.
Panggilan semula Widget
 

Dear visitor,

Your IP address shows that you are currently located in the USA. If you are a resident of the United States, you are prohibited from using the services of InstaFintech Group including online trading, online transfers, deposit/withdrawal of funds, etc.

If you think you are seeing this message by mistake and your location is not the US, kindly proceed to the website. Otherwise, you must leave the website in order to comply with government restrictions.

Why does your IP address show your location as the USA?

  • - you are using a VPN provided by a hosting company based in the United States;
  • - your IP does not have proper WHOIS records;
  • - an error occurred in the WHOIS geolocation database.

Please confirm whether you are a US resident or not by clicking the relevant button below. If you choose the wrong option, being a US resident, you will not be able to open an account with InstaForex anyway.

We are sorry for any inconvenience caused by this message.