Analysis of GBP/USD 5M
GBP/USD continued to trade higher on Friday, with the pound rising throughout the past week. The British currency even managed to edge up on Thursday, July 4, when the US celebrated Independence Day. In most cases, the market had reasons to sell the dollar, as almost all the most important economic reports turned out to be weaker than expected. However, we have already mentioned that the problem with the dollar is not the weak economic reports but the market's inflated expectations for these reports. Nevertheless, the market continues to ignore the highly likely easing of the Bank of England's monetary policy on August 1, while eagerly reacting to almost any negative information about the dollar.
Last week's movement can be described in one word—"continuous." The British pound returned to its highest levels in the past 10 months. If the pound surpasses these levels in the near future, it could signify the transition to forming a global upward trend. We still find it hard to imagine how the pound can rise if the BoE is on the verge of its first rate cut, while the Fed is far from considering such a move, but the market currently has a different logic. The pound is rising again, with and without reason.
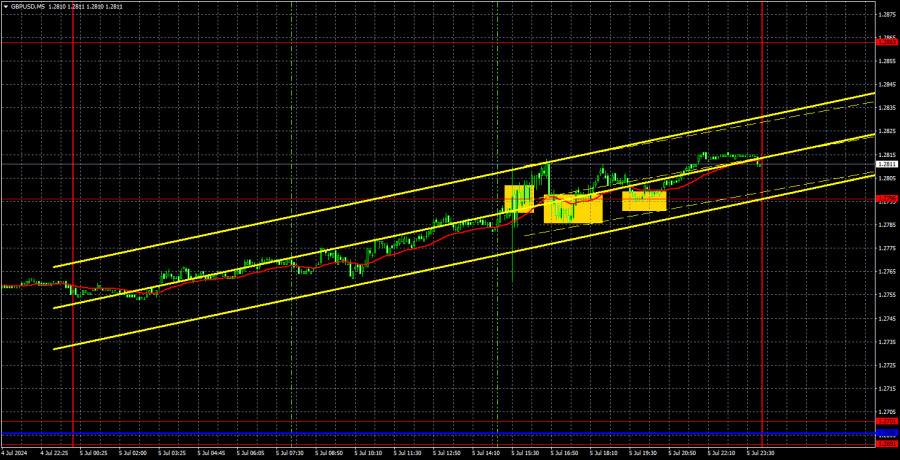
The pair formed three signals around the 1.2796 level on the 5-minute timeframe. All three were generated after the release of the US NonFarm Payrolls and unemployment data, which the market had the right to interpret as negative for the dollar. Therefore, we saw the characteristic burst of emotions for such moments and the price crossing the 1.2796 level. It was reasonable to open long positions amid weak US data, but the British pound has been rising for five consecutive days. Downward corrections should also take place. A rebound from the 1.2796-1.2816 area could trigger such a correction.
COT report:
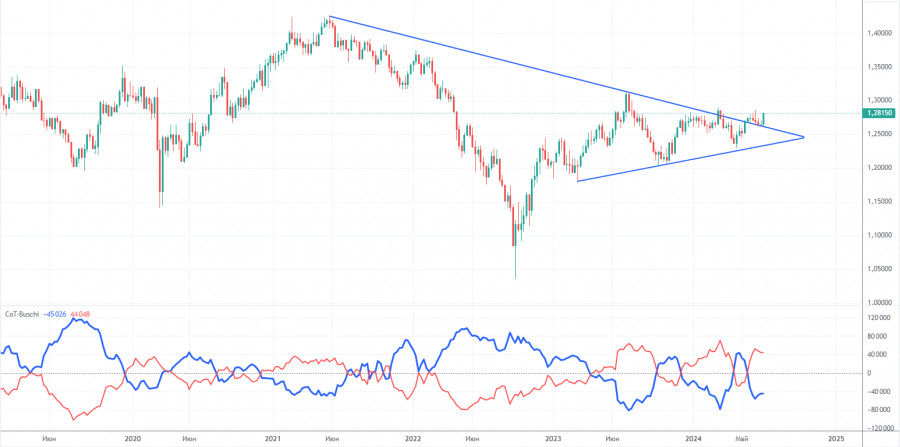
COT reports on the British pound show that the sentiment of commercial traders has frequently changed in recent years. The red and blue lines, which represent the net positions of commercial and non-commercial traders, constantly intersect and mostly remain close to the zero mark. According to the latest report on the British pound, the non-commercial group closed 3,400 buy contracts and opened 200 short ones. As a result, the net position of non-commercial traders decreased by 3,600 contracts over the week. Thus, sellers failed to seize the initiative.
The fundamental background still does not provide a basis for long-term purchases of the pound sterling, and the currency has a good chance to resume the global downward trend. However, the price has already breached the trend line on the 24-hour timeframe at least twice. The level of 1.2800 (which is the upper boundary of the sideways channel) is currently preventing the pound from rising further.
The non-commercial group currently has a total of 102,400 buy contracts and 58,500 sell contracts. The bulls are taking the lead in the market, but aside from the COT reports, nothing else suggests a potential rise in the GBP/USD pair. Such a strong advantage suggests that the pair may fall...
Analysis of GBP/USD 1H
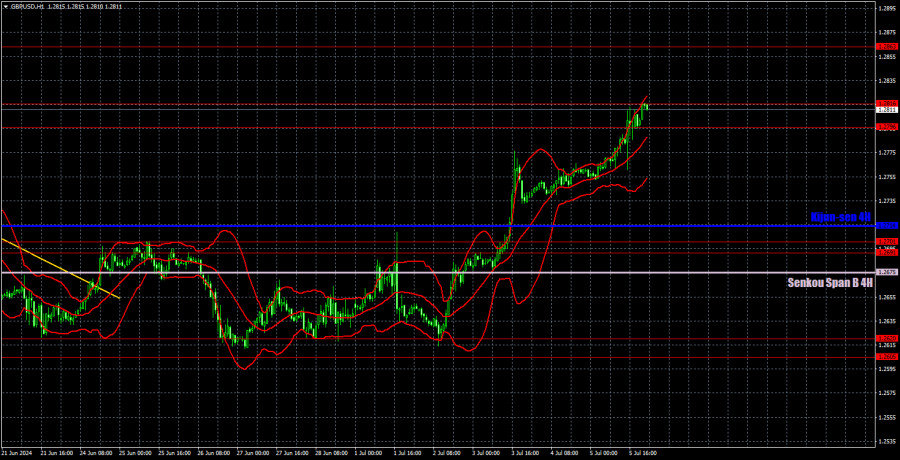
On the 1H chart, GBP/USD failed to overcome the 1.2605-1.2620 area. A new rebound from this area triggered another round of the corrective movement, and now the pair is near its 10-month highs. We expect the pound to fall in the medium-term, but the market is not interested in selling the pound regardless of the fundamental background. If the pair firmly overcomes the 1.2796-1.2816 area, we will consider the possibility of prolonging the upward trend. However, the pound shows erratic movements and volatility is also weak. It could turn out any other way.
As of July 8, we highlight the following important levels: 1.2215, 1.2269, 1.2349, 1.2429-1.2445, 1.2516, 1.2605-1.2620, 1.2691-1.2701, 1.2796-1.2816, 1.2863, 1.2981-1.2987. The Senkou Span B (1.2675) and Kijun-sen (1.2714) lines can also serve as sources of signals. Don't forget to set a Stop Loss to breakeven if the price has moved in the intended direction by 20 pips. The Ichimoku indicator lines may move during the day, so this should be taken into account when determining trading signals.
On Monday, there are no significant events in the UK or the US, but important speeches and reports are scheduled later in the week. Thus, the dollar could find new factors to push for a decline or a minor correction this week. If the pair continues to rise on Monday, it will confirm that once again the market is willing to buy the pound even without any grounds to support it.
Description of the chart:
Support and resistance levels are thick red lines near which the trend may end. They do not provide trading signals;
The Kijun-sen and Senkou Span B lines are the lines of the Ichimoku indicator, plotted to the 1H timeframe from the 4H one. They provide trading signals;
Extreme levels are thin red lines from which the price bounced earlier. They provide trading signals;
Yellow lines are trend lines, trend channels, and any other technical patterns;
Indicator 1 on the COT charts is the net position size for each category of traders;


