empty
 
 
29.11.2023 03:58 PM
How to trade the EUR/USD currency pair on November 29th? Simple tips and analysis of deals for beginners

Analysis of Tuesday's Transactions:

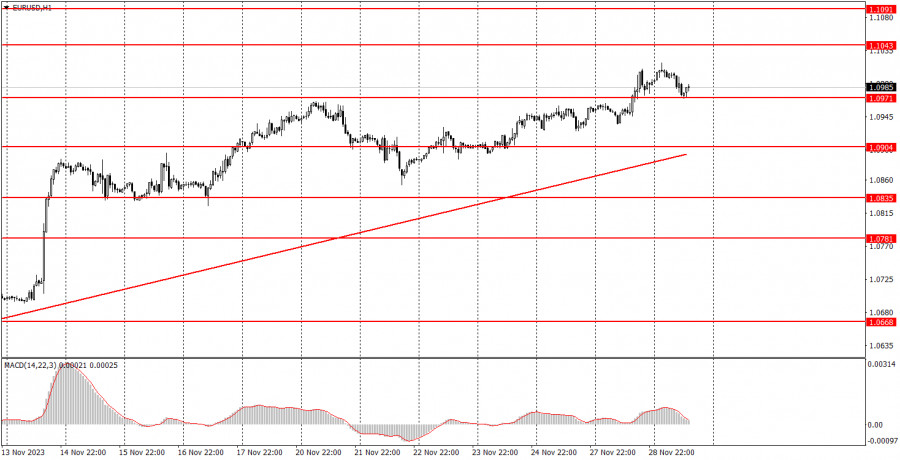
1-hour chart of the EUR/USD pair.

This image is no longer relevant

The currency pair EUR/USD continued its upward movement on Tuesday. Should we once again emphasize that the pair had no grounds for this? We mean fundamental and macroeconomic reasons. Throughout yesterday, novice traders could only pay attention to a series of speeches by representatives of the ECB and the Fed. However, none of the officials shared important information with the market. They all repeatedly say the same things: it is still too early to declare victory over inflation, the interest rate may be raised if necessary, and there are upward risks for inflation. The market has long known all this and has even memorized it. Therefore, such statements have no benefit.

From a technical point of view, the upward trend persists. Since the price continues to stay above the upward trend line, there is no reason to expect a strong decline in the pair now. Such reasons only exist if we recall the groundlessness of the current northward movement.

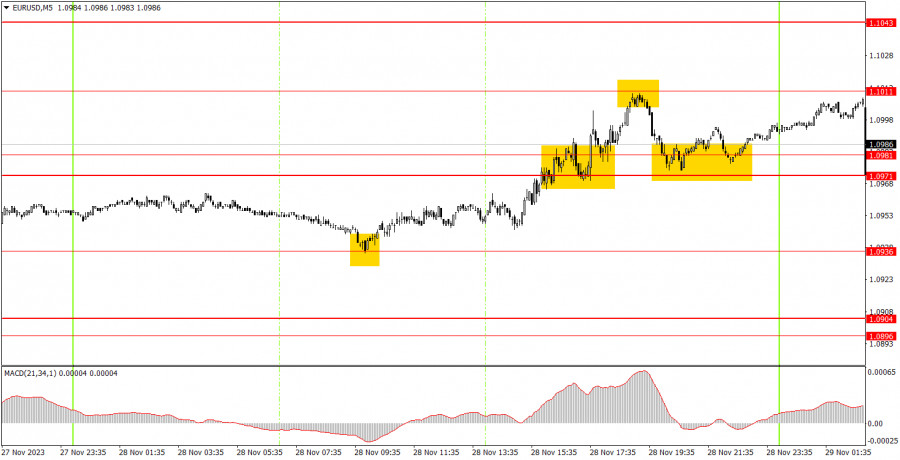
5-minute chart of the EUR/USD pair.
This image is no longer relevant

In the 5-minute timeframe, several good trading signals were formed yesterday, which should have been worked out. During the European trading session, the price bounced off the level of 1.0936, where long positions should have been opened. The price subsequently rose to the level of 1.1011, from which it almost perfectly bounced off in terms of accuracy. At this point, longs should have been closed (profit was about 50 points), and perhaps even a short position opened. The only concern was the time it took to form this signal. If beginners worked it out, they would make a profit of 20 points. If not, the first trade still brought a decent profit.

How to trade on Wednesday:

On the hourly timeframe, the pair maintains a correctional trend. A correction remains a correction, so we expect its completion and the resumption of the downward trend. At the moment, we have an upward trend line, so the completion of the correctional trend can be determined by the price settling below it. On the 5-minute timeframe tomorrow, consider the levels 1.0568, 1.0611-1.0618, 1.0668, 1.0733, 1.0767-1.0781, 1.0835, 1.0896-1.0904, 1.0936, 1.0971-1.0981, 1.1011, 1.1043, and 1.1091. When passing 15 points in the right direction, you can set a breakeven point. Stop Loss. On Wednesday, a relatively important inflation report for November will be released in Germany and the USA - the third estimate of GDP for the third quarter. Theoretically, both of these reports can provoke a market reaction, but in practice, it may not occur at all, or it may be completely different from what traders expect.

Main Rules of the Trading System:

  1. The strength of the signal is considered based on the time it took to form the signal (bounce or level breakthrough). The less time it took, the stronger the signal.
  2. If two or more trades were opened near a certain level on false signals, all subsequent signals from this level should be ignored.
  3. In a flat, any pair can form a lot of false signals or not form them at all. But in any case, at the first signs of a flat, it is better to stop trading.
  4. Trades are opened in the period between the start of the European session and the mid-American session when all trades must be manually closed.
  5. On the 30-minute timeframe, based on MACD signals, you can only trade with good volatility and a confirmed trend, indicated by the trend line or trend channel.
  6. If two levels are located too close to each other (from 5 to 15 points), they should be considered a support or resistance area.

What's on the Charts:

Support and resistance levels - levels that serve as targets when opening buy or sell positions. Take Profit levels can be placed around them.

Red lines - channels or trendlines that reflect the current trend and show the preferred direction for trading.

MACD indicator (14, 22, 3) - histogram and signal line - an auxiliary indicator that can also be used as a source of signals.

Important speeches and reports (always included in the news calendar) can greatly influence the movement of the currency pair. Therefore, during their release, it is advisable to trade with maximum caution or exit the market to avoid a sharp reversal of the price against the previous movement.

For beginners trading in the forex market, it is essential to remember that not every trade can be profitable. Developing a clear strategy and money management are the keys to success in trading over the long term.

Jana pendapatan melalui perubahan kadar mata wang kripto dengan InstaForex.
Muat turun MetaTrader 4 dan buka dagangan pertama anda.
  • Grand Choice
    Contest by
    InstaForex
    InstaForex always strives to help you
    fulfill your biggest dreams.
    SERTAI PERADUAN
  • Chancy Deposit
    Deposit akaun anda sebanyak $3,000 dan dapatkan $5000 lebih lagi!
    Dalam November kami membuat cabutan bertuah $5000 dalam Kempen Chancy Deposit!
    Dapatkan peluang untuk menang dengan membuat deposit $ 3000 ke dalam akaun dagangan. Setelah memenuhi syarat ini, anda menjadi peserta kempen.
    SERTAI PERADUAN
  • Trade Wise, Win Device
    Daftar untuk peraduan dan tambah dana akaun anda dengan sekurang-kurangnya AS$ 500 untuk layak memenangi peranti mudah alih.
    SERTAI PERADUAN
  • Bonus 100%
    Peluang istimewa anda untuk menerima bonus 100% pada deposit anda
    DAPATKAN BONUS
  • Bonus 55%
    Dapatkan bonus 55% pada setiap deposit anda
    DAPATKAN BONUS
  • Bonus 30%
    Dapatkan bonus 30% setiap kali anda membuat penambahan dana akaun anda
    DAPATKAN BONUS

Artikel yang dicadangkan

Tidak boleh bertanya sekarang?
Tanya soalan anda di Ruangan bersembang.
Panggilan semula Widget