empty
 
 
13.11.2023 12:32 PM
EUR/USD and GBP/USD: Trading plan for beginner traders on November 13, 2023

Details of the Economic Calendar on November 10

Industrial production data in the UK remained at the level of 1.5% despite expectations of a decline. However, the previous indicator was revised in favor of growth, from 1.3% to 1.5%, and the actual figures came in at 1.5% instead of 1.1% (YoY).

Analysis of Trading Charts from November 10

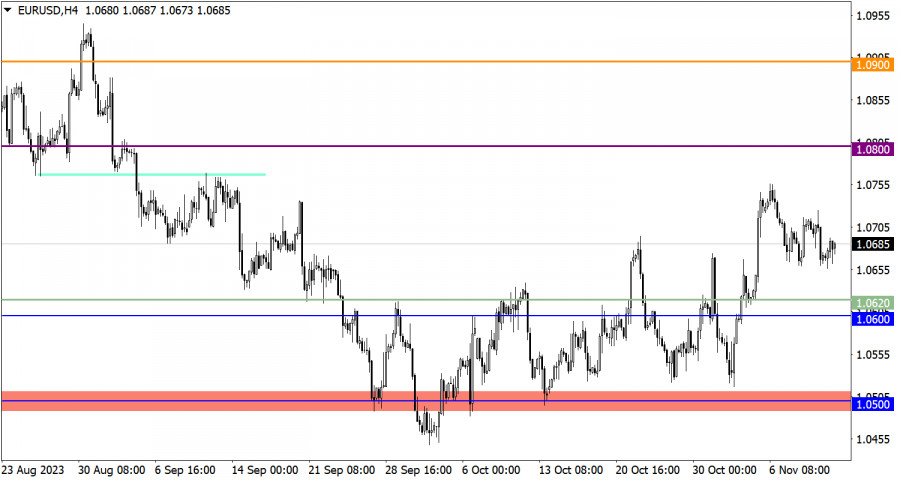
The EUR/USD currency pair slowed its decline and did not reach the 1.0650 mark. In fact, starting from the middle of last week, the quote has been in a conditional sideways range.

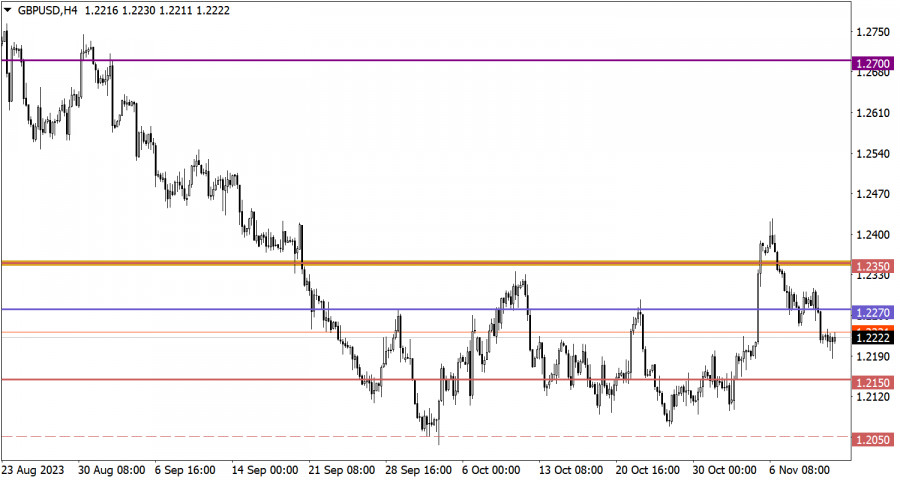
As for the GBP/USD pair, it temporarily dropped below the level of 1.2200, but then there was a reduction in the volume of short positions. As a result, the week ended with the formation of a two-digit doji candle, indicating a slowdown in the downward trend.

This image is no longer relevant

Economic Calendar for November 13

Monday, as usual, is accompanied by an empty macroeconomic calendar. No releases of important statistical data are expected in the European Union, the United Kingdom, and the United States.

In connection with this, investors and traders are likely to rely on the incoming news flow to make decisions in the market.

EUR/USD Trading Plan for November 13

In this situation, we have two key levels: the first is at 1.0650, which is considered in a downward scenario, and the second is at 1.0750. A breakout of the 1.0750 mark would indicate a continuation of the upward cycle.

This image is no longer relevant

GBP/USD Trading Plan for November 13

For further depreciation of the pound sterling, it is necessary for the price to stay below the level of 1.2200. In this case, we can expect a movement towards 1.2150.

As for the upward scenario, it is considered as a partial recovery of the value of the pound, taking into account the local oversold condition in short-term time periods. The level of 1.2200 can serve as a variable support, and if the price holds above this level, we can expect a gradual recovery of the quote above the value of 1.2270.

This image is no longer relevant

What's on the charts

The candlestick chart type is white and black graphic rectangles with lines above and below. With a detailed analysis of each individual candle, you can see its characteristics relative to a particular time frame: opening price, closing price, intraday high and low.

Horizontal levels are price coordinates, relative to which a price may stop or reverse its trajectory. In the market, these levels are called support and resistance.

Circles and rectangles are highlighted examples where the price reversed in history. This color highlighting indicates horizontal lines that may put pressure on the asset's price in the future.

The up/down arrows are landmarks of the possible price direction in the future.

Jana pendapatan melalui perubahan kadar mata wang kripto dengan InstaForex.
Muat turun MetaTrader 4 dan buka dagangan pertama anda.
  • Grand Choice
    Contest by
    InstaForex
    InstaForex always strives to help you
    fulfill your biggest dreams.
    SERTAI PERADUAN
  • Chancy Deposit
    Deposit akaun anda sebanyak $3,000 dan dapatkan $1000 lebih lagi!
    Dalam Oktober kami membuat cabutan bertuah $1000 dalam Kempen Chancy Deposit!
    Dapatkan peluang untuk menang dengan membuat deposit $ 3000 ke dalam akaun dagangan. Setelah memenuhi syarat ini, anda menjadi peserta kempen.
    SERTAI PERADUAN
  • Trade Wise, Win Device
    Daftar untuk peraduan dan tambah dana akaun anda dengan sekurang-kurangnya AS$ 500 untuk layak memenangi peranti mudah alih.
    SERTAI PERADUAN
  • Bonus 100%
    Peluang istimewa anda untuk menerima bonus 100% pada deposit anda
    DAPATKAN BONUS
  • Bonus 55%
    Dapatkan bonus 55% pada setiap deposit anda
    DAPATKAN BONUS
  • Bonus 30%
    Dapatkan bonus 30% setiap kali anda membuat penambahan dana akaun anda
    DAPATKAN BONUS

Artikel yang dicadangkan

Tidak boleh bertanya sekarang?
Tanya soalan anda di Ruangan bersembang.
Panggilan semula Widget