empty
 
 
30.10.2023 11:05 AM
EUR/USD, GBP/USD: trading plan for beginners on October 30, 2023

Economic calendar on October 27, 2023:

Last Friday, the macroeconomic calendar was nearly empty. The only report worthy to note was US personal income and spending data.

Statistics details:

Personal Income (m/m) (Sep). Previous: 0.4%, Forecast: 0.4%, Actual: 0.3%

Personal Spending (m/m) (Sep). Previous: 0.4%, Forecast: 0.4%, Actual: 0.7%

Overview of trading charts for October 27, 2023

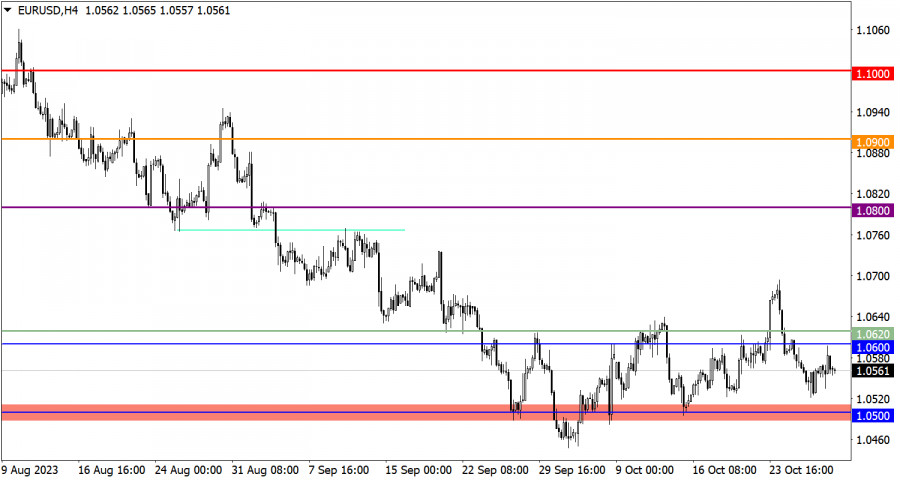
While moving upwards, the euro/dollar pair nearly reached the resistance level of 1.0600. Then the volume of long positions decreased, which allowed the greenback to pare some ground.

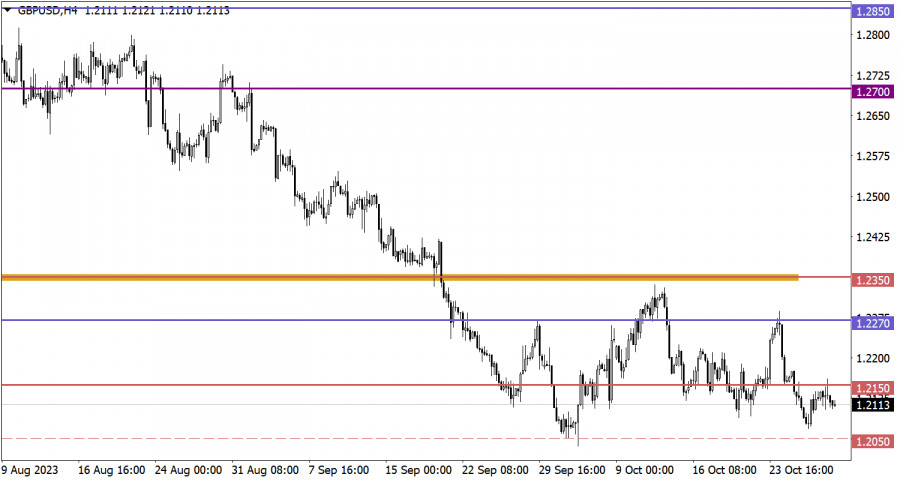
The pound/dollar pair traded in a local uptrend, but no dramatic changes occurred. The quote briefly surged to 1.2150 before reversing and losing value.

This image is no longer relevant

Economic calendar for October 30, 2023

Today's macroeconomic calendar is also bereft of any important news releases, except for UK lending market data.

EUR/USD trading plan for October 30, 2023

The euro/dollar pair is currently pulling back from the resistance level. In the case of a further increase in the volume of short positions, the euro might slide to the support level of 1.0500. However, if the dollar's current bullish run is short-lived and the quote consolidates above 1.0620, the market may move back to the upside.

This image is no longer relevant

GBP/USD trading plan for October 30, 2023

If the quote fails to consolidate above 1.2150, the pound sterling will lose value. A bear case scenario suggests a decline to the 1.2000/1.2150 area. However, if the quote stays firm above 1.2150, the British pound will most likely rise to the levels of 1.2200/1.2250.

This image is no longer relevant

What is shown on trading charts?

Candlestick charts are white and black graphic rectangles with lines above and below. While conducting a detailed analysis of each candlestick, you can notice its features intrinsic to a particular timeframe: the opening price, the closing price, as well as the highest and lowest prices;

Horizontal levels are price coordinates at which the price might pause or reverse. In the market, these levels are called support and resistance.

Circles and rectangles highlight examples where the price earlier reversed. This color highlighting points to horizontal lines that may influence the quote in the future.

Up/down arrows are indicators of possible future price directions.

Traders are recommended to read the following article:

EUR/USD and GBP/USD: Trading plan for beginner traders on October 27, 2023

Jana pendapatan melalui perubahan kadar mata wang kripto dengan InstaForex.
Muat turun MetaTrader 4 dan buka dagangan pertama anda.
  • Grand Choice
    Contest by
    InstaForex
    InstaForex always strives to help you
    fulfill your biggest dreams.
    SERTAI PERADUAN
  • Chancy Deposit
    Deposit akaun anda sebanyak $3,000 dan dapatkan $5000 lebih lagi!
    Dalam November kami membuat cabutan bertuah $5000 dalam Kempen Chancy Deposit!
    Dapatkan peluang untuk menang dengan membuat deposit $ 3000 ke dalam akaun dagangan. Setelah memenuhi syarat ini, anda menjadi peserta kempen.
    SERTAI PERADUAN
  • Trade Wise, Win Device
    Daftar untuk peraduan dan tambah dana akaun anda dengan sekurang-kurangnya AS$ 500 untuk layak memenangi peranti mudah alih.
    SERTAI PERADUAN
  • Bonus 100%
    Peluang istimewa anda untuk menerima bonus 100% pada deposit anda
    DAPATKAN BONUS
  • Bonus 55%
    Dapatkan bonus 55% pada setiap deposit anda
    DAPATKAN BONUS
  • Bonus 30%
    Dapatkan bonus 30% setiap kali anda membuat penambahan dana akaun anda
    DAPATKAN BONUS

Artikel yang dicadangkan

Tidak boleh bertanya sekarang?
Tanya soalan anda di Ruangan bersembang.
Panggilan semula Widget