empty
 
 
22.12.2021 05:14 PM
Bitcoin enters the accumulation zone: Glassnode

On-chain analytics firm Glassnode released interesting data, showing that the main cryptocurrency is entering the accumulation zone after one of the strongest capitulations in the history of this market.

This conclusion is based on the illiquid supply indicator. Judging by the volume of the supply, which is now assessed as illiquid on the network, BItcoin came out of the state of capitulation. Wallets now send their funds to organizations that choose to remain inactive rather than constantly making numerous transactions throughout the day.

The indicator also assumes an eight-month accumulation-distribution period during which Bitcoin reached its previous all-time high. After that, the market crashed, and correction lows were reached in July, and then bitcoin fell again in September. After that, the main cryptocurrency rose, renewing its historical value, to $69,000 per coin.

What the volume of illiquid supply shows

Now the volume of illiquid supply has reached 100,000 BTC per month. This means that traders are moving 100,000 bitcoins or more to inactive wallets that are known to have little or no transaction history.

The indicator also correlates with inflow and outflow indicators. As more traders and investors transfer funds to inactive wallets, the flow of funds to the exchange should begin to decline significantly.

During the recent drop, bitcoin lost over 38% of its value and the illiquid supply fell to -130,000 bitcoins per month. Inverted (with a minus sign) indicator values mean that traders have transferred their funds from illiquid wallets to exchange addresses or wallets with high transactional activity.

Wedge pattern creates prerequisites for recovery

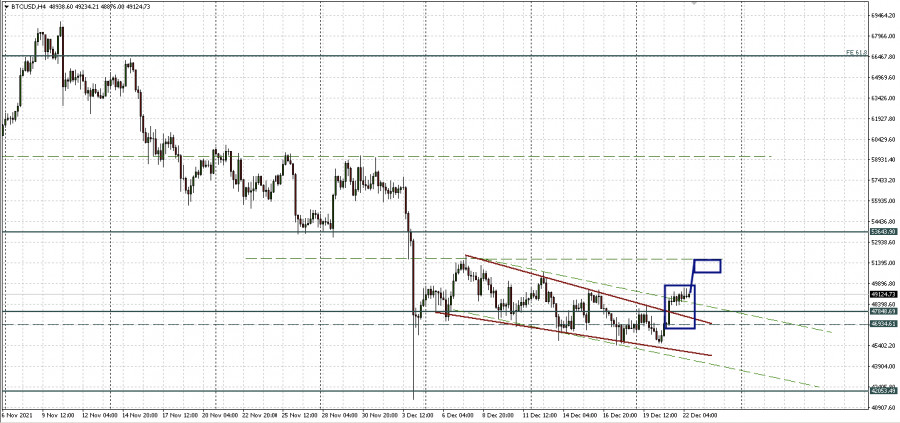
After Tuesday's forecast that bitcoin consolidation is taking place either within the wedge or within the channel, we have more data.

Initially, it was assumed that if the downward trend is estimated, then the probability of a downward reversal is high. But if we consider the wedge, the price went up from it during the impulse on Tuesday. This means that a rollback to its resistance is possible, and if it is confirmed by a rebound, as well as the mirror level of 47,848.69 as support, then BTCUSD has a chance to return to growth.

On Wednesday, we see that there is no contradiction since Tuesday's daily candlestick closed with a breakdown of both one and the second figure. And on the four-hour chart, we can even talk about the formation of a bullish flag, given Wednesday's consolidation.

Putting all these arguments together, we can predict the continued growth of BTCUSD. The target, in this case, taking into account the nearest level and the potential of the flag development, will be the horizontal line 51,697.58, marked with a green dotted line.

This image is no longer relevant

Jana pendapatan melalui perubahan kadar mata wang kripto dengan InstaForex.
Muat turun MetaTrader 4 dan buka dagangan pertama anda.
  • Grand Choice
    Contest by
    InstaForex
    InstaForex always strives to help you
    fulfill your biggest dreams.
    SERTAI PERADUAN
  • Chancy Deposit
    Deposit akaun anda sebanyak $3,000 dan dapatkan $6000 lebih lagi!
    Dalam Diseember kami membuat cabutan bertuah $6000 dalam Kempen Chancy Deposit!
    Dapatkan peluang untuk menang dengan membuat deposit $ 3000 ke dalam akaun dagangan. Setelah memenuhi syarat ini, anda menjadi peserta kempen.
    SERTAI PERADUAN
  • Trade Wise, Win Device
    Daftar untuk peraduan dan tambah dana akaun anda dengan sekurang-kurangnya AS$ 500 untuk layak memenangi peranti mudah alih.
    SERTAI PERADUAN
  • Bonus 100%
    Peluang istimewa anda untuk menerima bonus 100% pada deposit anda
    DAPATKAN BONUS
  • Bonus 55%
    Dapatkan bonus 55% pada setiap deposit anda
    DAPATKAN BONUS
  • Bonus 30%
    Dapatkan bonus 30% setiap kali anda membuat penambahan dana akaun anda
    DAPATKAN BONUS

Artikel yang dicadangkan

Tidak boleh bertanya sekarang?
Tanya soalan anda di Ruangan bersembang.
Panggilan semula Widget