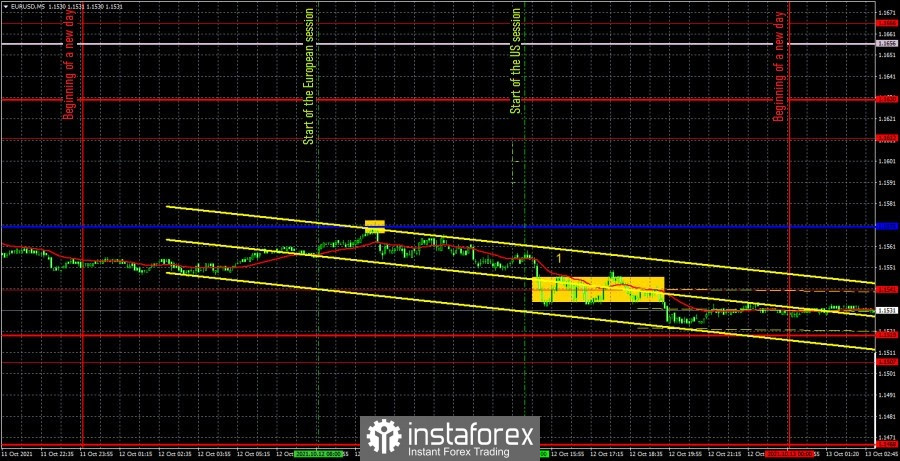
EUR/USD 5M

The EUR/USD pair continued to trade with low volatility during the second trading day of the week. Despite the fact that the movements look pretty good on the 5-minute timeframe, it should be understood that this is just a 5-minute timeframe. When switching to the 1-minute TF, the movements will look even more impressive. If we calculate the volatility of the previous day, then we get a value of about 40 points again. Moreover, when switching to the 4-hour timeframe, it is clearly seen that the Bollinger Bands indicator (standard settings) clearly indicates not just flat, but total flat, since its bands have narrowed to an absolute low and are directed sideways. Thus, in such conditions, all trading signals that are generated should be strictly filtered. Before we begin to analyze them, it should also be mentioned that European Central Bank President Christine Lagarde delivered a speech yesterday. However, a day earlier, it was not on the calendar of macroeconomic events. However, there was no particular reaction to it again. The start time is marked in the chart above with the number "1". As you can see, the markets had already exhausted their fuse by that time. Returning to trading signals. The first was formed at the beginning of the European session - for selling - in the form of a rebound from the critical line. However, we have already said in the last articles that in conditions of a flat, the Ichimoku indicator lines lose their strength and the price can cross them as many times as necessary, thus generating false signals. Despite the fact that this signal could have earned a couple of dozen points, it still should not have been worked out. The second signal was much worse than the first. The price reached the extremum level of 1.1541 and for several hours either went above it or settled below it. Therefore, there was no clear signal to buy or sell. Therefore, this signal also had to be filtered.
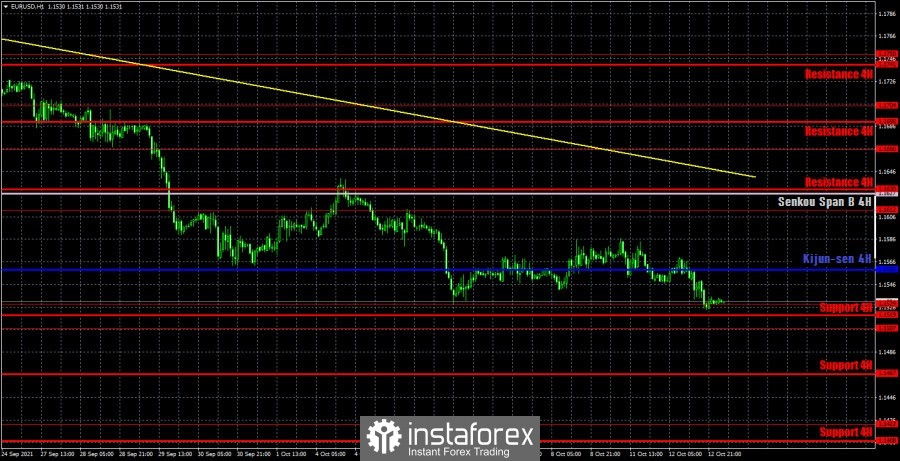
EUR/USD 1H
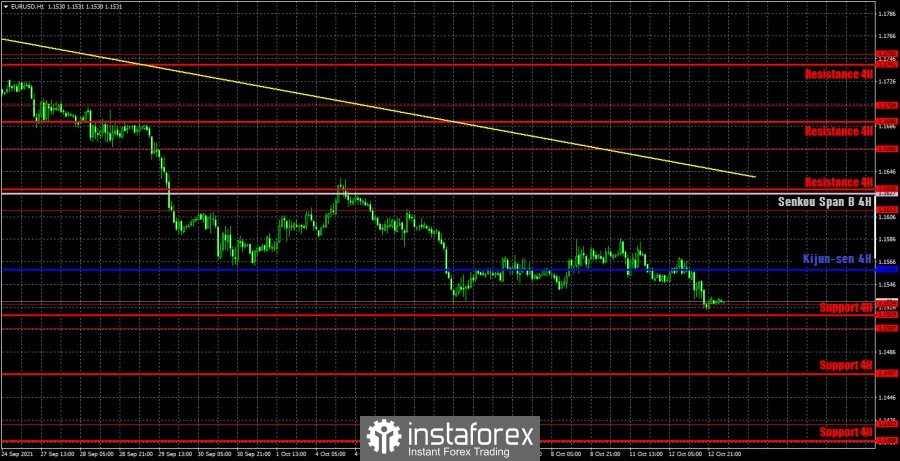
You can see that the euro/dollar pair has not been able to correct to the downtrend line on the hourly timeframe and continues to remain at a respectable distance from it. Thus, the downward trend continues, while the dollar may continue to strengthen. Unfortunately, volatility is also poor. It is so weak that even on a 5-minute timeframe it is quite difficult to find signals and make money on them. We are completely silent about the fundamental background, since the markets simply ignore all reports not in favor of the dollar. We highlight the following levels for trading on Wednesday - 1.1468, 1.1507, 1.1529, 1.1612, as well as the Senkou Span B (1.1627) and Kijun-sen (1.1559) lines. The Ichimoku indicator lines can change their position during the day, which should be taken into account when looking for trading signals. Signals can be rebounds or breakthroughs of these levels and lines. Do not forget about placing a Stop Loss order at breakeven if the price moves 15 points in the right direction. This will protect you against possible losses if the signal turns out to be false. We also remind you that Bollinger Bands are now indicating a flat on the 4-hour TF. If they do not begin to expand up or down, then the signals from the Ichimoku lines should be ignored. The European Union will publish an insignificant report on industrial production on October 13, and in the US - inflation for September and the Federal Reserve minutes. The last two events could theoretically have a strong impact on the US dollar. However, the main thing is that it does not work out as well as with the Nonfarm report on Friday.
We also recommend that you familiarize yourself with the forecast and trading signals for the GBP/USD pair.
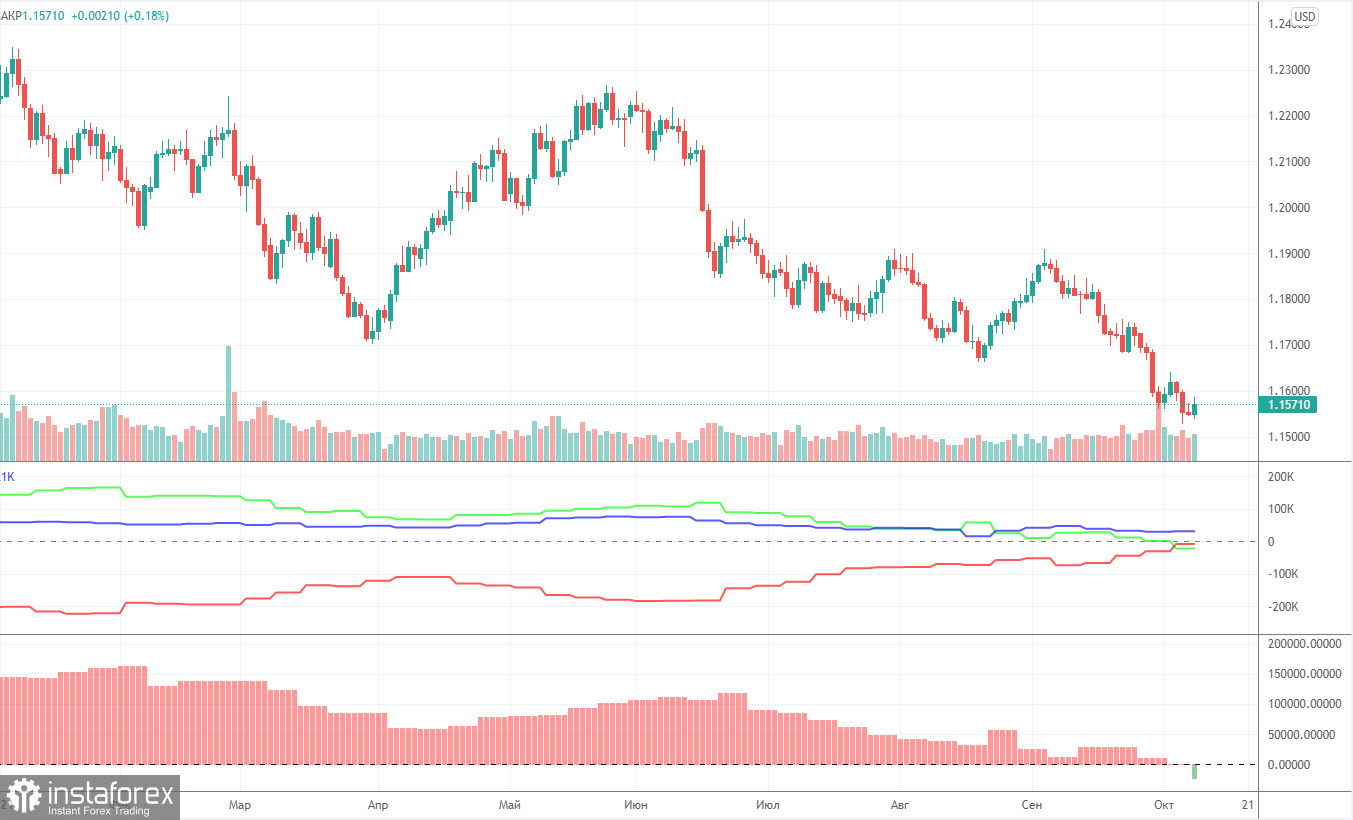
COT report
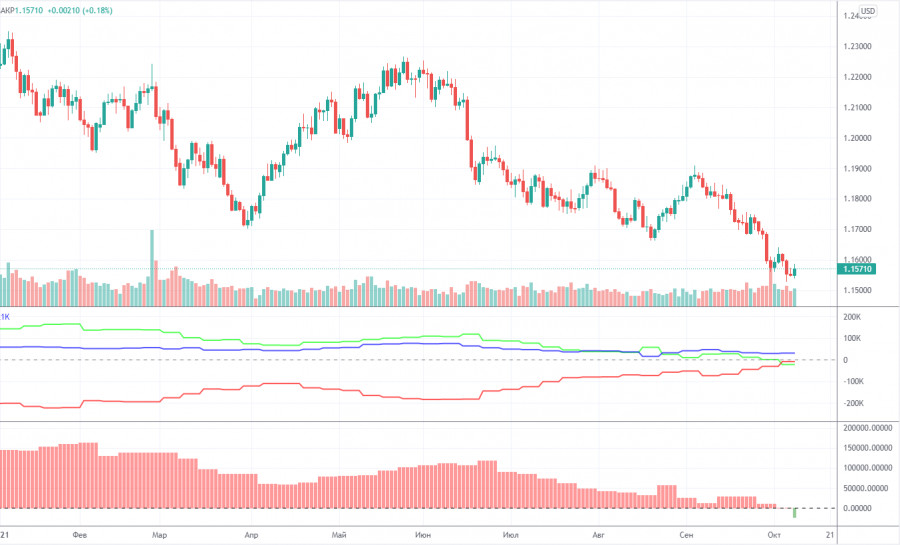
The mood of non-commercial traders became fully bearish during the last reporting week (September 28 - October 4). If a week earlier the number of buy and sell contracts for major players practically coincided, then after the next Commitment of Traders (COT) report the balance of forces changed in favor of the bears. During the reporting week, professional traders opened 26,000 sell contracts (shorts) and only 2.5 thousand buy contracts (longs) of the euro. Thus, the net position of the "non-commercial" group decreased immediately by 23,500, which is a lot even for the euro. At the same time, the total number of buy contracts became less than the number of sell contracts. Now the first 198,000 ones are open for large players, and the second - 220,000.So now it is already possible to announce that the mood for the euro currency has formed bearish, which significantly increases the likelihood of a further fall in the EU currency. The first indicator in the chart above, which displays the change in net positions of all groups of traders, clearly shows that the green line has gone below zero, and the red line is about to cross it from the bottom up. Thus, traders can immediately receive a double signal for a further fall in the euro. First, the red and green lines will intersect, which indicates a change in mood. Secondly, both of these lines will cross the zero mark, which indicates the same thing. In general, based on the COT reports, the likelihood of a further fall in the euro is growing. Technique is now saying the same thing.
Explanations for the chart:
Support and Resistance Levels are the levels that serve as targets when buying or selling the pair. You can place Take Profit near these levels.
Kijun-sen and Senkou Span B lines are lines of the Ichimoku indicator transferred to the hourly timeframe from the 4-hour one.
Support and resistance areas are areas from which the price has repeatedly rebounded off.
Yellow lines are trend lines, trend channels and any other technical patterns.
Indicator 1 on the COT charts is the size of the net position of each category of traders.
Indicator 2 on the COT charts is the size of the net position for the non-commercial group.