empty
 
 
19.11.2024 03:41 AM
Trading Recommendations and Trade Analysis for GBP/USD on November 19: The 26th Level Held Firm Against Decline

GBP/USD 5-Minute Analysis

This image is no longer relevant

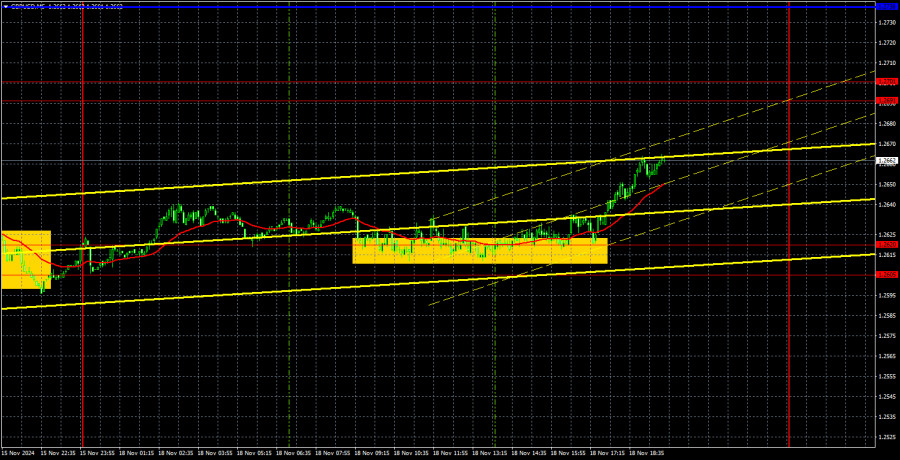
The GBP/USD pair attempted a correction on Monday. The 1.2605-1.2620 zone was tested accurately, followed by a notable rebound. This provided an opportunity for cautious long positions. However, Monday lacked any significant fundamental or macroeconomic events. We continue to believe that the pound's downtrend is not yet over. While the pound has fallen for nearly two months, occasional corrections are expected. The pair has encountered a strong support zone at this point, but significant upward movement would require compelling macroeconomic and fundamental reasons, which are currently absent.

On Wednesday, the pound may find some support. If the UK inflation report exceeds forecasts, the Bank of England may take an even slower approach to cutting interest rates soon. This could serve as a basis for a more substantial rise in the pound. However, in the medium term, we still expect further declines.

On Monday, only one trading signal formed, which took 5-6 hours to form. The price rebounded accurately from the 1.2605-1.2620 area, allowing traders to consider long positions targeting the 1.2691-1.2701 area. After a 30-40-pip movement, a Stop Loss could be moved to breakeven to secure profits.

COT Report

This image is no longer relevant

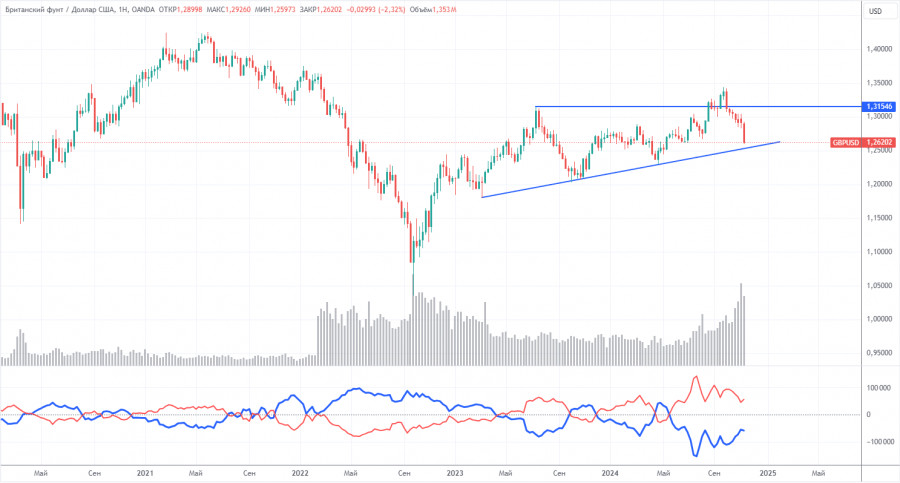
The COT reports on the British pound show that commercial traders' sentiment has been highly volatile in recent years. The red and blue lines representing the net positions of commercial and non-commercial traders frequently intersect and usually hover near the zero mark. The most recent downward trend coincided with the red line being below zero. Currently, the red line is above zero.

According to the latest COT report, the non-commercial group closed 700 BUY contracts and 11,700 SELL contracts. As a result, the net position of non-commercial traders grew by 11,000 contracts over the week. While the market is not rushing to sell the pound sterling in the medium term, the movements of the past six weeks are encouraging.

The fundamental backdrop still provides no basis for long-term pound purchases, and the pound has a realistic chance of resuming its global downtrend. However, on the weekly timeframe, there is an upward trendline. Until this trendline is broken, long-term expectations of a decline in the pound remain speculative. For now, the pound continues to demonstrate significant resilience against the dollar.

GBP/USD 1-Hour Analysis

This image is no longer relevant

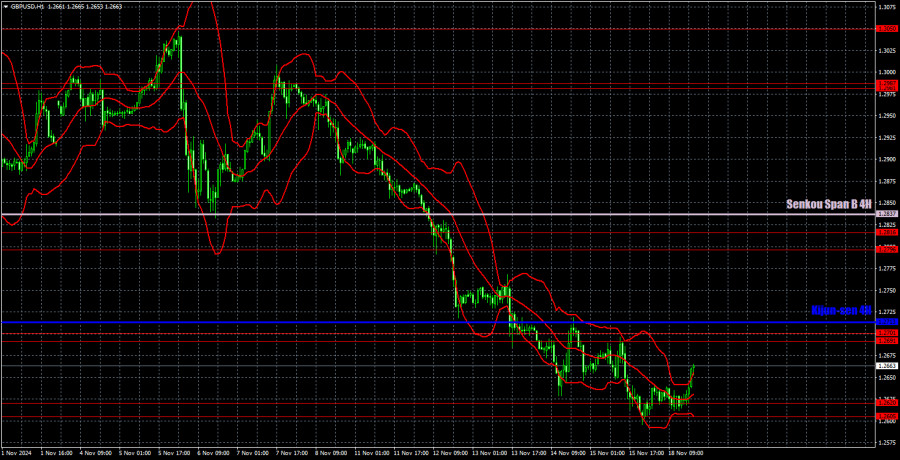
On the hourly timeframe, the GBP/USD pair maintains a bearish outlook. The upward trend has been canceled, and further declines in the British pound, both strong and prolonged, are expected. The last correction turned out to be flat and has already ended. A new correction may begin, as the 1.2605-1.2620 zone served as solid support. However, there are still no fundamental reasons to expect a substantial rise in the pound.

For November 19, we highlight the following important levels: 1,2429-1,2445, 1,2516, 1,2605-1,2620, 1,2796-1,2816, 1,2863, 1,2981-1,2987, 1,3050. Senkou Span B (1.2837) and Kijun-sen (1.2713) lines can also be sources of signals. Setting Stop Loss level to breakeven when the price passes 20 pips in the intended direction is recommended. The lines of the Ichimoku indicator may move during the day, which should be considered when determining trading signals.

There is no important data scheduled for Tuesday in the UK, while in the US, there will be reports on building permits and new home construction. We consider these reports secondary and do not expect a strong market response to them.

Chart Explanations:

Support and resistance levels: thick red lines around which movement may end. They are not sources of trading signals.

Kijun-sen and Senkou Span B lines: Ichimoku indicator lines transferred from the 4-hour to the 1-hour timeframe. These are strong lines.

Extreme levels: thin red lines where the price previously rebounded. They are sources of trading signals.

Yellow lines: Trend lines, trend channels, and other technical patterns.

Indicator 1 on COT charts: The net position size for each category of traders.

Paolo Greco,
InstaForex के विश्लेषणात्मक विशेषज्ञ
© 2007-2024
Earn on cryptocurrency rate changes with InstaForex
Download MetaTrader 4 and open your first trade
  • Grand Choice
    Contest by
    InstaForex
    InstaForex always strives to help you
    fulfill your biggest dreams.
    कॉन्टेस्ट में हिस्सा लें
  • चैन्सी डिपॉजिट
    $ 3,000 के साथ अपना खाता जमा करें और प्राप्त करें $6000 अधिक!
    में दिसंबर हम आकर्षित करते हैं $6000 चैंसी डिपॉज़िट में
    ट्रेडिंग अकाउंट में $ 3,000 जमा करके जीतने का अवसर प्राप्त करें इस शर्त को पूरा करके आप प्रतियोगिता में भाग ले सकते हैं
    कॉन्टेस्ट में हिस्सा लें
  • ट्रेड वाइज़, विन डिवाइस
    कम से कम $500 के साथ अपने खाते में टॉप अप करें, कॉन्टेस्ट के लिए साइन अप करें और मोबाइल डिवाइस जीतने का मौका पाएं।
    कॉन्टेस्ट में हिस्सा लें
  • 100% बोनस
    अपनी जमा राशि पर 100% बोनस प्राप्त करने का आपका अनूठा अवसर
    बोनस पायें
  • 55% बोनस
    अपनी प्रत्येक डिपॉजिट पर 55% बोनस के लिए आवेदन करें
    बोनस पायें
  • 30% बोनस
    हर बार खाता टॉप अप करने पर 30% बोनस प्राप्त करें
    बोनस पायें

अनुशंसित लेख

अभी बात नहीं कर सकते?
अपना प्रश्न पूछें बातचीत.
Widget callback