The GBP/USD pair also continued its upward movement calmly. It goes without saying that no data or news were supporting the latest rise in the British currency. As we've consistently pointed out in 2024, the pair often displays illogical, irregular movement. If anyone had doubts, they can now see this firsthand. If one were to accept explanations like 'increased risk appetite,' then the movement might seem logical. The challenge lies in the uncertainty of when this 'increase in risk appetite ' will transition to 'risk aversion '.
The British currency has been appreciating almost every day. It is certainly possible to argue that the Federal Reserve is highly likely to start lowering rates on September 18, which means the dollar could continue to fall daily for an entire month. After all, the first Fed rate cut, which the market has been anticipating since January, is an event that should move the market by hundreds of points. A rate cut by the Bank of England or the European Central Bank shouldn't, but just the anticipation of a Fed rate cut must.
Naturally, this is sarcasm, but nothing can be done about the current movement. One can study technical indicators and fundamental and macroeconomic backgrounds as much as one likes, but if major players in the market are driving the pair upward, it will increase under any circumstances. This is because only supply and demand affect the price, not news, reports, or Fed Chair Jerome Powell's speeches. However, many traders and analysts need some explanation for the movements. Hence, the narrative becomes "a new dose of dovish rhetoric is expected from the Fed chair on Friday, and the Fed will cut rates on September 18." This is precisely why the dollar has been falling for two weeks straight. Powell may be excessively dovish on Friday, and the Fed will lower the key rate in September, which the market has already priced in about five times in recent months.
There is another hypothesis that explains the current plunge in the American currency. Major players may deliberately push the dollar down as low as possible to later buy it at the most favorable prices for themselves. It is worth noting that the decline in the American currency began when US inflation started to slow down. The market always tries to anticipate global fundamental events in advance. However, we often see movements that contradict logic and common sense when the event occurs. Thus, we assume that the euro and the pound will rise until September 18, and then, when the Fed officially begins its monetary policy easing cycle, the dollar will start to rise.
Meanwhile, most market participants will continue to explain movements using terms like "increased risk appetite/risk aversion." US data will immediately turn positive, and it will be revealed that the state of the American economy is excellent, with no sign of recession. Everyone will also remember that the dollar had been falling for quite some time, even though, as it turns out, there was no strong reason for it. Therefore, we would not be surprised if similar illogical movements were observed in the year's second half, but in the opposite direction.

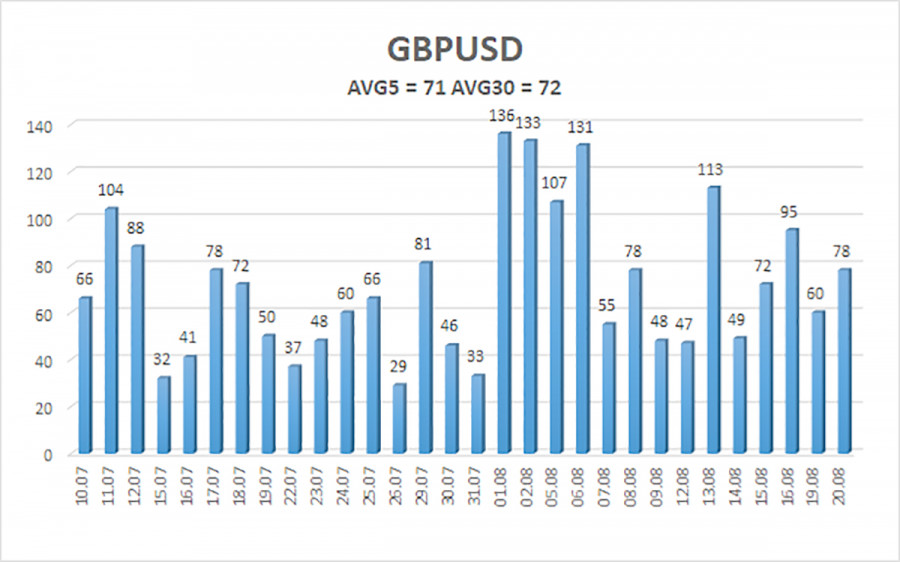
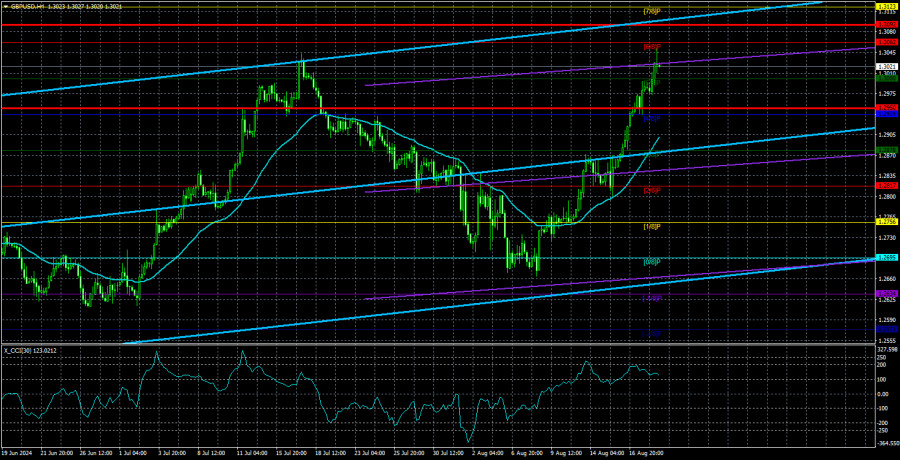
The average volatility of the GBP/USD pair over the past 5 trading days is 71 pips. For the GBP/USD pair, this value is considered "average." On Wednesday, August 21, we expect movement within the range bounded by levels 1.2950 and 1.3092. The upper channel of the linear regression is directed upwards, signaling the continuation of the uptrend. The CCI indicator may soon enter the overbought zone again and has already formed a bearish divergence.
Nearest Support Levels:
- S1 – 1.3000
- S2 – 1.2939
- S3 – 1.2878
Nearest Resistance Levels:
- R1 – 1.3062
- R2 – 1.3123
- R3 – 1.3184
Trading Recommendations:
The GBP/USD pair continues its illogical rise but retains a good chance of resuming a downward momentum. We are not considering long positions at this time, as we believe that the market has already addressed all the bullish factors for the British currency (which are not much) several times. Short positions could be considered at least after the price consolidates below the moving average. For now, the current rise in the pair can be viewed as another phase of the correction, which means there are prospects for the British currency to decline below the last low of 1.2665.
Explanations for Illustrations:
Linear Regression Channels: help determine the current trend. If both are directed in the same direction, it means the trend is strong.
Moving Average Line (settings 20,0, smoothed): determines the short-term trend and the direction in which trading should be conducted.
Murray Levels: target levels for movements and corrections.
Volatility Levels (red lines): the probable price channel in which the pair will spend the next 24 hours, based on current volatility indicators.
CCI Indicator: Entering the oversold area (below 250) or the overbought area (above +250) means a trend reversal is approaching.


