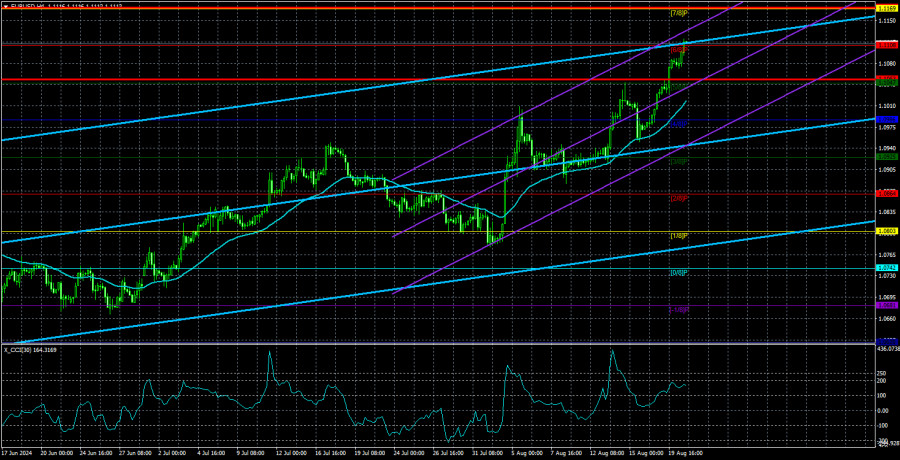
The EUR/USD pair on Tuesday didn't even attempt to correct, at least not in the first half of the day. In general, the euro continues to grow like yeast almost every day. The most the dollar can hope for under current conditions is a 50-60 pips correction. Thus, the technical picture remains unchanged.
However, the mood among many currency analysts and experts is shifting. The pair has been rising almost daily, and some explanation for this movement is needed. But how do you explain it when there are no news or reports? Classic explanations start to appear, such as "increasing risk appetite" or "rising dovish expectations regarding the Federal Reserve." Admittedly, one can explain almost any movement with just these two phrases.
For example, when the US dollar falls without a clear reason, it's because 'risk appetite is increasing in the market.' If the US dollar rises without any visible causes, it's because 'risk appetite is decreasing in the market.' This is the entire puzzle. The factors that trigger a rise or fall in risk appetite are never fully explained. The method to predict this risk appetite is also a mystery. In our perspective, the majority of experts seem to explain any movement only in retrospect. In reality, it's much simpler. The EUR/USD pair rises simply because it is being bought.
It's crucial to keep in mind that the market is 'ruled' by large players, who execute transactions worth millions and billions of dollars. These significant players, including various banks and major funds, possess a wealth of information about the market and prevailing sentiment, far more than retail traders. They have the power to influence prices and steer them in their desired direction. And their desired direction is naturally not disclosed to ordinary traders, who are diligently analyzing news and reports. Moreover, market makers may not even consider news, reports, and various events. They are not bound to do so!
As a result, we occasionally experience movements that are difficult to explain in hindsight. For example, the market has anticipated a Fed rate cut since January. During this entire time, the US dollar has fallen much more often than the fundamental and macroeconomic background would suggest. The market doesn't perceive weakness in the European economy but eagerly responds to weak macroeconomic data from the US. Since the beginning of the year, the market has been reacting to an anticipated Fed rate cut that hasn't yet happened, while the easing of European Central Bank monetary policy doesn't interest it. Thus, there is no logic in the current rise of the euro. Large players are operating in the market, and they have their own logic for decision-making at the moment. The only thing left is to try to follow them or pause until the movements normalize. Even technical indicators that suggest a rise in the dollar are simply not working. CCI has entered the overbought zone three times, yet the pair continues to rise calmly.

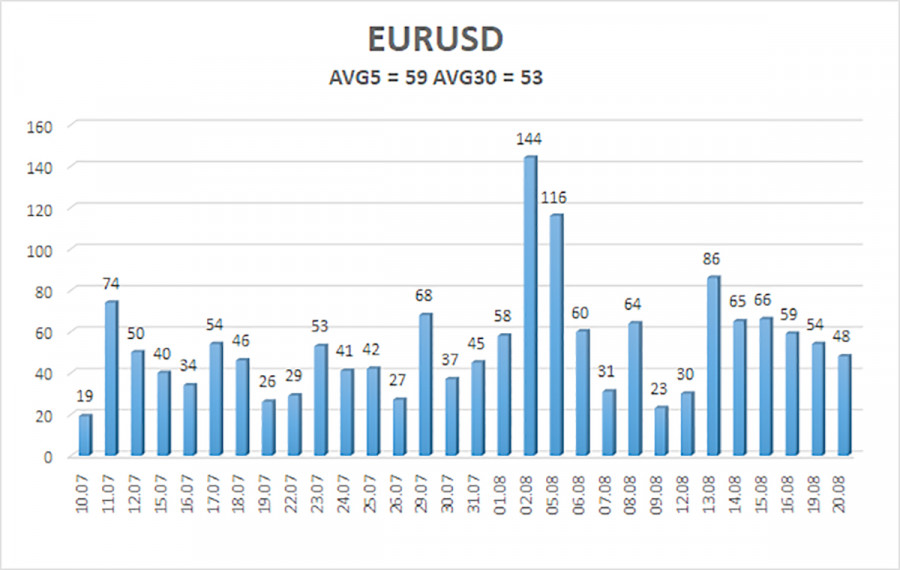
The average volatility of EUR/USD over the past five trading days as of August 21 is 59 pips, which is considered average. We expect the pair to move between the levels of 1.1052 and 1.1171 on Wednesday. The upper channel of the linear regression is directed upwards, but the global downtrend persists. The CCI indicator entered the overbought area for the third time, which warns not only of a possible trend reversal to the downside but also of how the current rise is entirely illogical.
Nearest Support Levels:
- S1 – 1.1047
- S2 – 1.0986
- S3 – 1.0925
Nearest Resistance Levels:
- R1 – 1.1108
- R2 – 1.1169
- R3 – 1.1230
Trading Recommendations:
The EUR/USD pair maintains a global downward trend, but in the 4-hour time frame, the upward movement has resumed due to a new series of macroeconomic reports from the US and the market's relentless desire to buy euros and sell dollars continuously. In previous reviews, we mentioned that we only expect declines from the euro in the medium term, but the current rise now seems almost like a mockery. However, it would be foolish to deny that the price is in an upward movement, and there are no signs of its end yet. The market continues to use every opportunity for purchases, but the technical picture warns of a high probability of the local upward trend ending.
Explanations for Illustrations:
Linear Regression Channels: help determine the current trend. If both are directed in the same direction, it means the trend is strong.
Moving Average Line (settings 20,0, smoothed): determines the short-term trend and the direction in which trading should be conducted.
Murray Levels: target levels for movements and corrections.
Volatility Levels (red lines): the probable price channel in which the pair will spend the next 24 hours, based on current volatility indicators.
CCI Indicator: Entering the oversold area (below 250) or the overbought area (above +250) means a trend reversal is approaching.


