Analysis of EUR/USD 5M
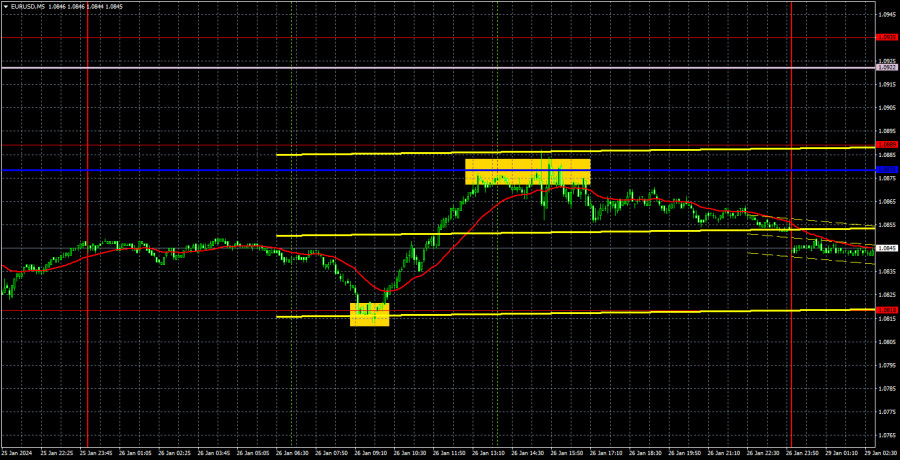
EUR/USD showed quite a bit of turmoil on Friday. First, it reached the level of 1.0823 once again, failed to overcome it for the third time in a week, and then corrected to the critical line. The current movement can be interpreted as both a downward and sideways movement. The price is still falling from time to time, and even if we look at the hourly timeframe, we can see that it is mostly moving sideways.
The current flat range can be limited by the levels of 1.0823 and 1.0935. That is, despite seeing quite strong movements, the pair has been in a 100-point sideways channel since January 16. Therefore, we came to the conclusion that the pair is still in a flat phase. Just like the pound. The only difference is that for the euro the flat lasted for two weeks, while it was a month and a half for the pound.
However, the technical picture could really change this week. We can look forward to two central bank meetings, important EU inflation reports, labor market and ISM business activity reports in the US. There will be a lot of events, so there's a good chance that the flat phase may end for both pairs. Of course, there could be a situation when volatility will rise, but both pairs will still stay within the sideways channels. That can happen too. But if not now, then when should we expect the flat to end? We believe that both the euro and the pound should continue their downward movement.
Speaking of trading signals, there were only two on Friday. The price bounced from the level of 1.0818 during the European session, and from the critical Kijun-sen line in the US session. Traders could make a profit in both cases.
COT report:
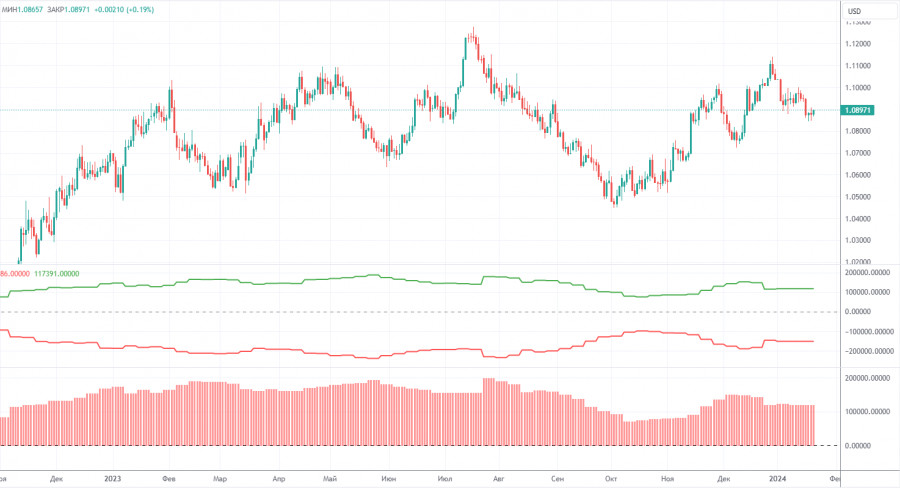
The latest COT report is dated January 23. As seen in the charts above, it is clear that the net position of non-commercial traders has been bullish for quite some time. To put it simply, the number of long positions is much higher than the number of short positions. This should support the euro, but we still do not see fundamental factors for the euro to strengthen further. In recent months, both the euro and the net position have been rising. However, over the past few weeks, big players have started to reduce their long positions, and we believe that this process will continue.
We have previously pointed out that the red and green lines have moved apart from each other, which often precedes the end of a trend. At the moment, these lines are still far apart. Therefore, we support the scenario in which the euro should fall and the uptrend must end. During the last reporting week, the number of long positions for the non-commercial group decreased by 9,100, while the number of short positions increased by 6,600. Accordingly, the net position fell by 15,700. The number of buy contracts is still higher than the number of sell contracts among non-commercial traders by 89,000 (it was at 104,000). The gap is quite large, and even without COT reports, it is clear that the euro should continue to fall.
Analysis of EUR/USD 1H
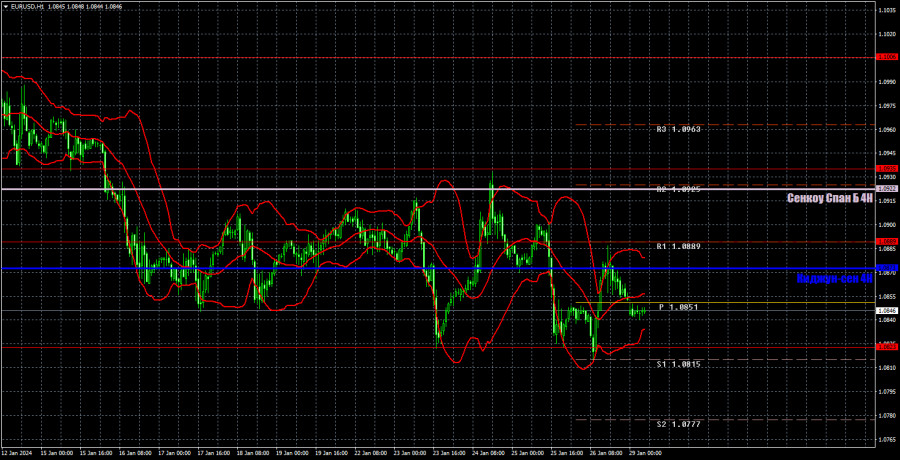
On the 1-hour chart, EUR/USD tested the Kijun-sen line on Friday but failed to stay above it. Everything indicates that the euro has slightly corrected upward, and now it is ready for a new decline. We fully support this scenario, but there is a possibility that the flat phase will persist between the levels of 1.0823 and 1.0935.
Today, we believe that the price may simply return to the critical line once again. If the price bounces from it, we will consider new short positions with 1.0823 as the target. You may consider long positions if we can confirm that the price has settled above the Kijun-sen and we can use Senkou Span B as the target. However, in general, the flat could persist in today's upward movement.
On January 29, we highlight the following levels for trading: 1.0658-1.0669, 1.0757, 1.0823, 1.0889, 1.0935, 1.1006, 1.1092, 1.1137, 1.1185, 1.1234, 1.1274, as well as the Senkou Span B (1.0922) and Kijun-sen (1.0873) lines. The Ichimoku indicator lines can move during the day, so this should be taken into account when identifying trading signals. Don't forget to set a breakeven Stop Loss if the price has moved in the intended direction by 15 pips. This will protect you against potential losses if the signal turns out to be false.
On Monday, European Central Bank Vice President Luis de Guindos will speak, while the US event calendar is empty. Therefore, it is unlikely for volatility to be high today, and the price may probably stay in the sideways channel.
Description of the chart:
Support and resistance levels are thick red lines near which the trend may end. They do not provide trading signals;
The Kijun-sen and Senkou Span B lines are the lines of the Ichimoku indicator, plotted to the 1H timeframe from the 4H one. They provide trading signals;
Extreme levels are thin red lines from which the price bounced earlier. They provide trading signals;
Yellow lines are trend lines, trend channels, and any other technical patterns;
Indicator 1 on the COT charts is the net position size for each category of traders;
Indicator 2 on the COT charts is the net position size for the Non-commercial group.


