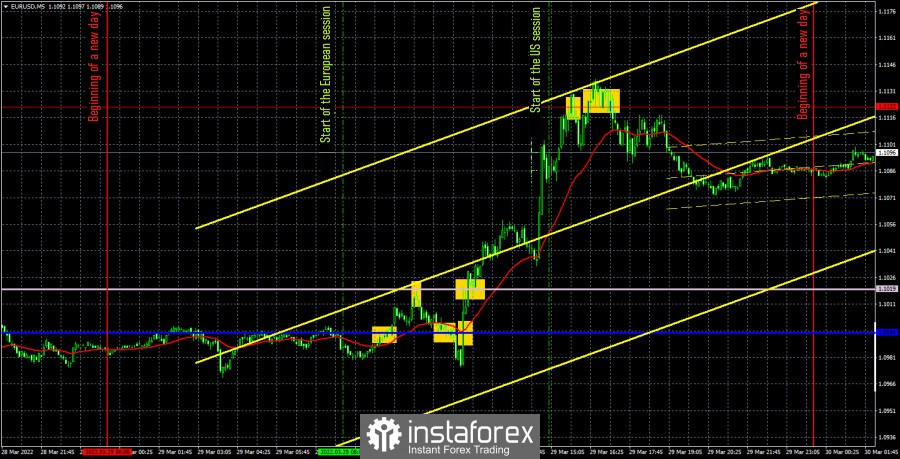
EUR/USD 5M
The EUR/USD pair was trading very actively on Tuesday. It was impossible to predict this movement, since in the middle of the day it became known that the negotiating groups of Kiev and Moscow had unexpectedly made a breakthrough and now the probability of signing a peace agreement that would end the military conflict between Ukraine and Russia has sharply increased. It is thanks to this information that the euro has grown today. Due to this information, the pair showed volatility of more than 150 points. All other events of the day (of which there were very few) had no effect on the movement of the euro/dollar pair. Thus, we can only say that the whole movement of Tuesday is not indicative. It cannot be considered within the framework of any trend. And it is also impossible to conclude that now the euro will grow. The direction of the negotiation process may change. The next round of negotiations will take place in Turkey today.
As for trading signals, there were a lot of them on Tuesday. Only 5 signals were generated near the Senkou Span B and Kijun-sen lines. The first and second signals should have been ignored, since at the time of their formation, the price was almost resting on the nearby line. The third signal turned out to be unprofitable. The fourth one should have been ignored for the same reasons as the first two. Only the fifth buy signal about overcoming the Senkou Span B line was successful. After that, the price rose to the extreme level of 1.1122 and bounced off it twice. Not very accurate, but still. This transaction made it possible to cover the loss of the first transaction and earn on top. Moreover, the sell signal near the level of 1.1122 should also be worked out, since it was strong. It was possible to earn several dozen more points. Thus, the total profit turned out to be large.
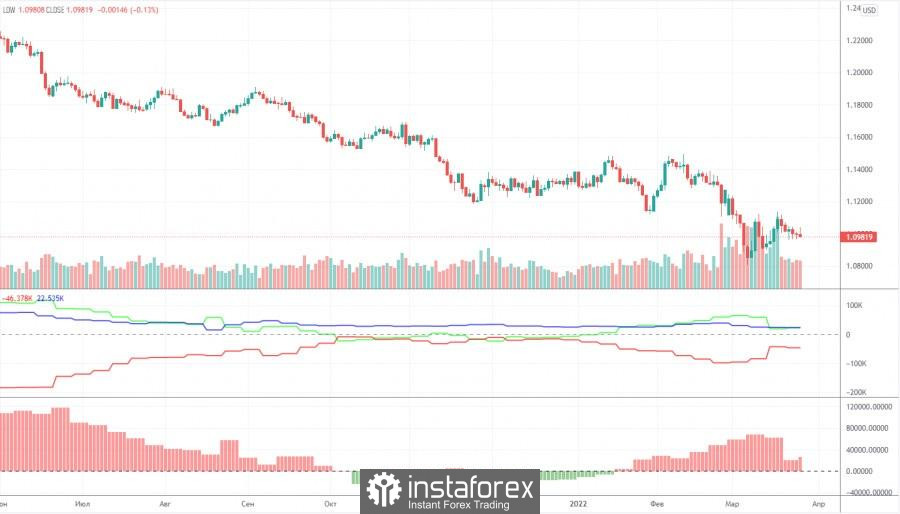
COT report:

In the last two months, Commitment of Traders (COT) reports have signaled such changes in the mood of traders, which absolutely did not correspond to what was actually happening in the foreign exchange market. However, in the last two weeks, COT reports have at least begun to coincide a little with what is happening in the foreign exchange market. The major players in the last reporting week greatly reduced their net position, thanks to the meetings of the European Central Bank and the Federal Reserve, the results of which were very eloquent. This week, professional traders opened 5,000 long positions and closed 38 short positions. That is, the net position has increased by 5,000 contracts. Formally, the bullish mood, which remains exactly bullish, has slightly intensified. But look at the chart of the pair's movement in the chart above: the euro does nothing but fall. In this way, the euro is now only capable of local technical corrections. Fundamental and geopolitical factors have a huge impact on the market, so we do not believe that traders now have a reason to buy the euro currency. Therefore, the non-commercial group of traders can buy euros, sell euros, all the same, with the current foundation and geopolitics, the US dollar will grow. This is due to the fact that the COT report on the euro currency does not take into account changes in demand for the dollar itself. That is, it is reasonable to assume that the demand for the US currency is growing at a faster pace than the demand for the EU currency.
We recommend to familiarize yourself with:
Overview of the EUR/USD pair. March 30. The euro and the pound shot up on expectations of an agreement between Ukraine and Russia.
Overview of the GBP/USD pair. March 30. Speech by Andrew Bailey... Who is interested in it now? Negotiations between Kiev and Moscow!
Forecast and trading signals for GBP/USD on March 30. Detailed analysis of the movement of the pair and trading transactions.
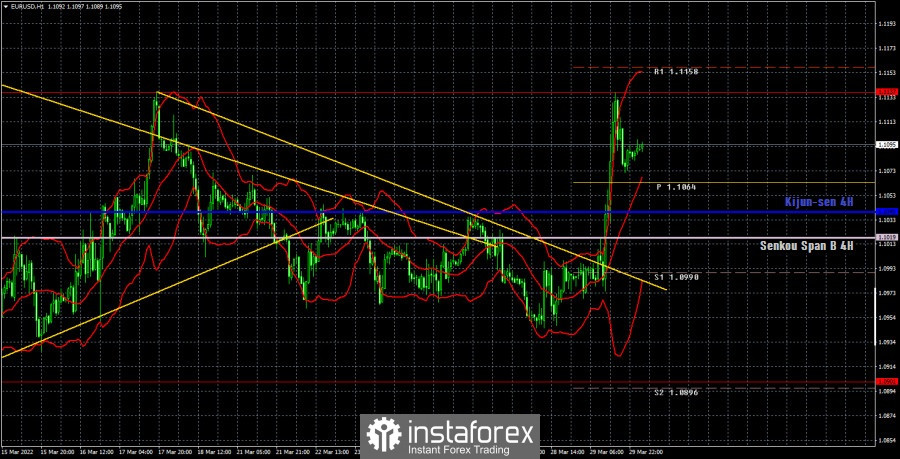
EUR/USD 1H

All trend lines have been overcome on the hourly timeframe. However, as we have already said, yesterday's movement cannot be considered within the framework of any trend. It was too emotional. The pair may rush back down by today. A breakthrough in the negotiations is, of course, good, but so far no agreements have been concluded, and the fire does not stop.We allocate the following levels for trading on Wednesday – 1.0806, 1.0901, 1.1137, 1.1234, as well as the Senkou Span B (1.1019) and Kijun-sen (1.1040) lines. The lines of the Ichimoku indicator can move during the day, which should be taken into account when determining trading signals. There are also support and resistance levels, but no signals will be formed near them. Signals can be "bounces" and "breakthrough" levels - extremes and lines. Do not forget about placing a Stop Loss order at breakeven if the price went in the right direction of 15 points. This will protect you against possible losses if the signal turns out to be false. On March 30, European Central Bank President Christine Lagarde will give a speech in the European Union. And in the US – the ADP report on the number of employees in the private sector and the GDP report for the first quarter of 2022. All three events are very important, but the negotiations between Russia and Ukraine in Turkey are also very important, the second round of which is scheduled for today.
Explanations for the chart:
Support and Resistance Levels are the levels that serve as targets when buying or selling the pair. You can place Take Profit near these levels.
Kijun-sen and Senkou Span B lines are lines of the Ichimoku indicator transferred to the hourly timeframe from the 4-hour one.
Support and resistance areas are areas from which the price has repeatedly rebounded off.
Yellow lines are trend lines, trend channels and any other technical patterns.
Indicator 1 on the COT charts is the size of the net position of each category of traders.
Indicator 2 on the COT charts is the size of the net position for the non-commercial group.