To open long positions on EURUSD, you need:
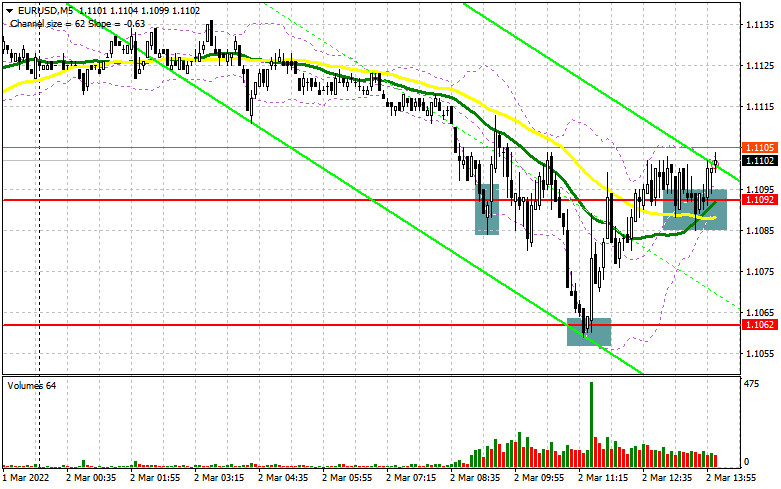
In my morning forecast, I paid attention to the 1.092 level and recommended that decisions on entering the market be made from it. Let's look at the 5-minute chart and figure out what happened. The data released today on the German labor market, which once again demonstrated growth and a sharp jump in inflation in the eurozone to a level of 5.8% per annum - all this allowed euro buyers to protect the 11th figure. The test and the formation of a false breakdown at the beginning of the European session at 1.092 led to a buy signal, but after moving up by 25 points, the pressure on the euro returned. Breakthrough 1.1092 led to a collapse and the formation of a false breakdown at 1.1062. As a result, a buy signal was formed, after which the pair quickly recovered back to 1.092, allowing it to take about 30 points off the market. From a technical point of view, there are some changes in the afternoon that you should pay attention to. And what were the entry points for the pound this morning?

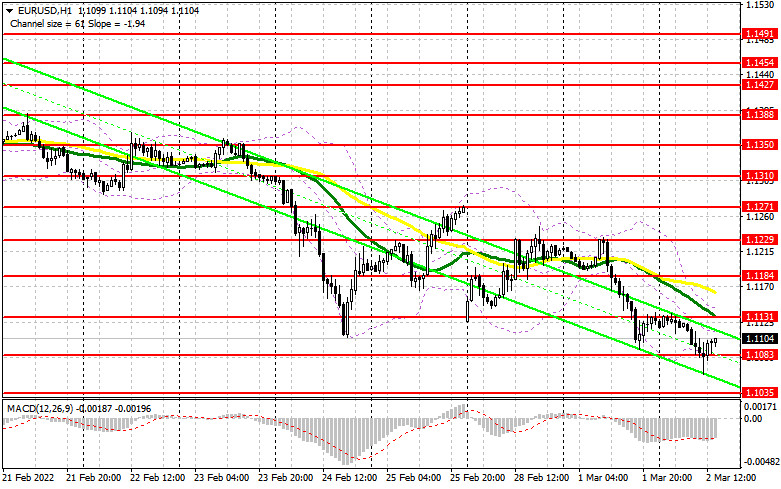
The news that the next meeting of representatives of Russia and Ukraine will take place in the near future, at which the difficult geopolitical situation will be discussed, led to a return in demand for risky assets, which also kept the euro from selling off in the first half of the day. In the afternoon, several fundamental statistics on the American economy are released, and Federal Reserve Chairman Jerome Powell also speaks, which may lead to another wave of dollar growth. The inflation situation in the US is likely to worsen in the near future, which will force the central bank to act more aggressively. An important task of the bulls for the second half of the day will be to protect the nearest support of 1.1083, formed by the results of the first half of the day. As long as trade is conducted above this level, we can count on the continued growth of the euro. The formation of a false breakdown, in the case of a decline in the pair to 1.1083, will give an entry point into long positions to continue the upward correction of the pair. It is possible to count on a larger recovery of EUR/USD only after the smoothing of military tensions and active actions of buyers in the area of 1.1131, where the moving averages are playing on the side of the bears. A breakthrough and a test of this range during the release of weak data on changes in the number of employed from the US ADP will lead to a buy signal and open up the possibility of recovery to the area of 1.1184, where I recommend fixing profits. However, as I noted above, geopolitical tensions will affect the euro, so with the further aggravation of the military conflict, the demand for the US dollar will only increase. If there is no activity at 1.1083, traders will start closing long positions, which will only increase the pressure on the pair. Therefore, it is best to postpone purchases until a false breakdown in the area of a new low of 1.1035, but it is possible to gain long positions on the euro immediately for a rebound from the level of 1.0994, or even lower - around 1.0957 with the aim of an upward correction of 20-25 points within a day.
To open short positions on EURUSD, you need:
Sellers tried to push the 11th figure, but nothing came of it. Active purchases in this area against the background of strong inflation confirm traders' expectations of a more active change in the course of monetary policy by the European Central Bank. In addition to the US data, Chairman of the Fed Board of Governors Jerome Powell is speaking this afternoon, who can quickly turn the dollar exchange rate towards the south. An important task of the bears in the second half of the day will be to protect the resistance of 1.1131, to which the pair is now heading. The formation of a false breakdown at this level, as well as strong data from ADP together with negative news on Ukraine - all this will be a signal to open short positions to further reduce EUR/USD to the area of 1.1083. The breakdown of this area is very important, and the reverse test from the bottom up will give an additional signal to open short positions already with the prospect of falling to a minimum of 1.1035. There is also 1.0994 very close, where I recommend fixing the profits. In the case of strong fundamental statistics for the United States, you can count on the 1.0957 test. Under the scenario of euro growth during the American session and the absence of bears at 1.1131, it is best not to rush with sales. The optimal scenario will be short positions when forming a false breakdown in the area of 1.1184. You can sell EUR/USD immediately for a rebound from 1.1229, or even higher - around 1.1271 with the aim of a downward correction of 15-20 points.

The COT report (Commitment of Traders) for February 22 again recorded a reduction in both long and short positions, which led to an increase in the positive delta, as there were much fewer short positions. In the context of a severe geopolitical conflict that has affected almost the whole world, it makes no sense to talk about what the policy of the European Central Bank or the Federal Reserve System will be since, in the event of an aggravation of the military conflict, it will make no difference. Now Russia and Ukraine have sat down at the negotiating table, and a lot will depend on the results of these meetings - there will be a lot of them. In the current conditions, it will not be too correct to consider the COT report, especially considering its secondary information for the trader. I advise you to be quite careful about risky assets and buy euros only as the tense relations between Russia, Ukraine, the EU, and the USA weaken. Any new sanctions actions against the Russian Federation will have serious economic consequences, which will affect the financial markets, as well as affect not only the Russian ruble but also the European currency. This will happen because of Russia's response to sanctions, which the EU will not like - an additional factor of pressure on the euro. The COT report indicates that long non-commercial positions decreased very slightly from the level of 217,899 to the level of 214,195, while short non-commercial positions decreased from the level of 170,318 to the level of 155,889. This suggests that although fewer people are willing to sell euros, there are no more buyers from this. It seems that traders prefer to sit on the sidelines of those events that are now rapidly gaining momentum. At the end of the week, the total non-commercial net position increased to 59,306 against 47,581. The weekly closing price remained unchanged at 1.1309 against 1.1305 a week earlier.
Signals of indicators:
Moving averages
Trading is conducted below 30 and 50 daily moving averages, which indicates the bearish nature of the market.
Note: The period and prices of moving averages are considered by the author on the hourly chart H1 and differ from the general definition of the classic daily moving averages on the daily chart D1.
Bollinger Bands
In the case of growth, the upper limit of the indicator in the area of 1.1131 will act as resistance. A breakthrough of the lower limit of the indicator in the area of 1.1083 will increase pressure on the euro.
Description of indicators
- Moving average (moving average determines the current trend by smoothing out volatility and noise). Period 50. The graph is marked in yellow.
- Moving average (moving average determines the current trend by smoothing out volatility and noise). Period 30. The graph is marked in green.
- MACD indicator (Moving Average Convergence / Divergence - moving average convergence/divergence) Fast EMA period 12. Slow EMA period 26. SMA period 9
- Bollinger Bands (Bollinger Bands). Period 20
- Non-profit speculative traders, such as individual traders, hedge funds, and large institutions that use the futures market for speculative purposes and meet certain requirements.
- Long non-commercial positions represent the total long open position of non-commercial traders.
- Short non-commercial positions represent the total short open position of non-commercial traders.
- Total non-commercial net position is the difference between the short and long positions of non-commercial traders.


