empty
 
 
02.03.2022 09:13 AM
Trading plan for novice traders on EUR/USD and GBP/USD, March 2

Macroeconomic calendar on March 1

Yesterday, Manufacturing PMI indexes for the EU, the UK, and the United States were published. However, traders ignored this data. They are still focused on news about the Russia-Ukraine conflict. For a long time, fundamental news is of greater importance to speculators than macroeconomic ones.

Trading charts on March 1

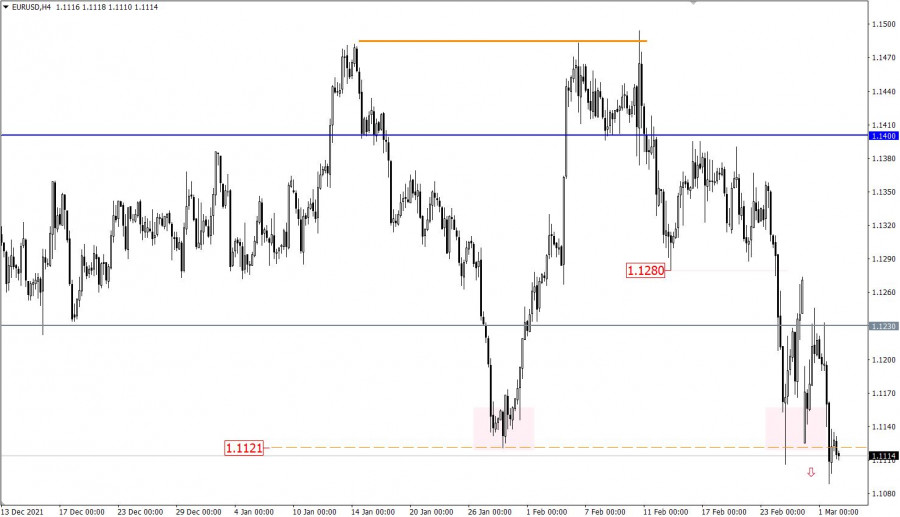
The EUR/USD pair has once again reached a new low within the current downtrend. The price dropped below the level of 1.1121 on the 4H chart, signaling an increase in the volume of short positions in the market.

On the daily chart, there is a prolongation of the medium-term downtrend.

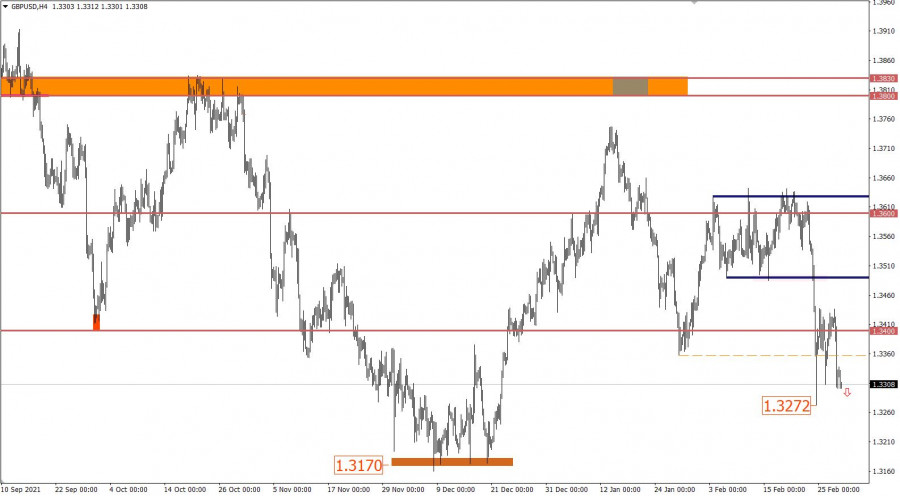
The GBP/USD pair resumed a decline after a short-term consolidation near 1.3437, a high of February 25. As a result, the pound sterling fell back to the levels of the last week.

This image is no longer relevant

Macroeconomic calendar on March 2

The EU is going to reveal inflation data. Consumer prices are expected to rise to 5.4% from 5.1%. Apparently, inflation continues to accelerate. It is unclear whether the ECB will decide to tighten monetary policy or not.

During the US session, the US will unveil the ADP report. The reading is projected to grow by 388,000 in February. If this scenario comes true, it will indicate a further revival of the labor market.

EU inflation– 13:00 MSK

US ADP report– 16:15 MSK

Geopolitical news

Market volatility is high as news on the Russia-Ukraine conflict changes rapidly. Forex and stock markets are vulnerable to such news. This is why it is recommended to close monitor this news in other to be ready for sharp market swings.

Trading plan for EUR/USD on March 2

If the price holds steadily below a low of 1.3272 on the 4H chart, it may also decline to 1.3160.

This image is no longer relevant

Trading plan for GBP/USD on March 2

A rebound from 1.3437 may trigger a decrease to 1.3357–1.3300. It will also indicate a rise in the volume of long positions on the US dollar. Alternatively, the price may consolidate above 1.3450 on the 4H chart. If so, the pair could return to 1.3480–1.3500.

This image is no longer relevant

Description of the charts

The candlestick chart consists of white and black rectangles with lines on top and bottom. With a detailed analysis of each individual candlestick, you can see the opening price, closing price, high and low on the chart.

Horizontal levels are levels of support and resistance that help traders determine when a trend reversal may occur.

Circles and rectangles indicate the levels where the price once rebounded. This color selection shows horizontal lines that may exert pressure on the quotes in the future.

The up/down arrows show the possible trajectory of the price.

Gven Podolsky,
InstaForex के विश्लेषणात्मक विशेषज्ञ
© 2007-2024
Earn on cryptocurrency rate changes with InstaForex
Download MetaTrader 4 and open your first trade
  • Grand Choice
    Contest by
    InstaForex
    InstaForex always strives to help you
    fulfill your biggest dreams.
    कॉन्टेस्ट में हिस्सा लें
  • चैन्सी डिपॉजिट
    $ 3,000 के साथ अपना खाता जमा करें और प्राप्त करें $5000 अधिक!
    में नवंबर हम आकर्षित करते हैं $5000 चैंसी डिपॉज़िट में
    ट्रेडिंग अकाउंट में $ 3,000 जमा करके जीतने का अवसर प्राप्त करें इस शर्त को पूरा करके आप प्रतियोगिता में भाग ले सकते हैं
    कॉन्टेस्ट में हिस्सा लें
  • ट्रेड वाइज़, विन डिवाइस
    कम से कम $500 के साथ अपने खाते में टॉप अप करें, कॉन्टेस्ट के लिए साइन अप करें और मोबाइल डिवाइस जीतने का मौका पाएं।
    कॉन्टेस्ट में हिस्सा लें
  • 100% बोनस
    अपनी जमा राशि पर 100% बोनस प्राप्त करने का आपका अनूठा अवसर
    बोनस पायें
  • 55% बोनस
    अपनी प्रत्येक डिपॉजिट पर 55% बोनस के लिए आवेदन करें
    बोनस पायें
  • 30% बोनस
    हर बार खाता टॉप अप करने पर 30% बोनस प्राप्त करें
    बोनस पायें

अनुशंसित लेख

अभी बात नहीं कर सकते?
अपना प्रश्न पूछें बातचीत.
Widget callback