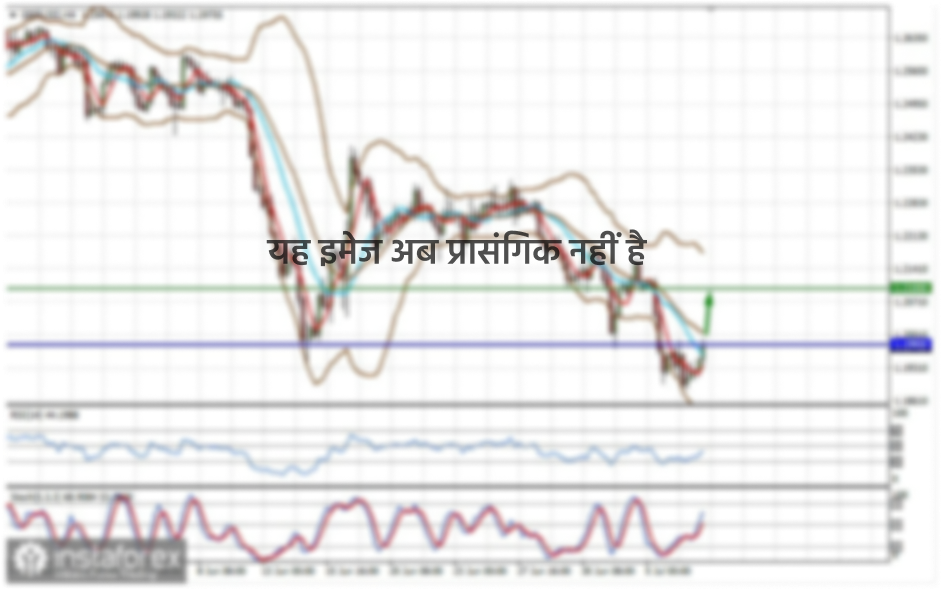
From the point of view of integrated analysis, we see a concentration of trading forces within the price levels of the past week. The past trading days were expressed in a consecutive downward course, where quotes gained a foothold in the area of the range level of 1.0775 twice, but shifted to the mirror level of 1.0850, which formed a variable corridor between the levels of 1.0775 and 1.0850, which market participants focused on.
With all these movements, downward development is still possible, and the chance to update the lows is literally achievable at any time, since the level of 1.0775 is no longer considered a solid support, as it was a period earlier.
Analyzing yesterday's trading by minutes, we can see that activity was low, but the downward move was stable and lasted until the close of the daily candle.
In terms of volatility, a slowdown in activity was observed since Wednesday last week, where the average decrease is 28% relative to the average daily value.
If we recall the indicators of activity last year, the 60-point dynamics was considered the norm, which means that volatility will soon become stable.
Volatility detail
MARCH: Monday [March 9] - 155 points; Tuesday - 183 points; Wednesday - 115 points; Thursday - 278 points; Friday - 166 points; Monday - 151 points; Tuesday - 234 points; Wednesday - 243 points; Thursday - 326 points; Friday - 194 points; Monday - 191 points; Tuesday - 160 points; Wednesday - 133 points; Thursday - 188 points; Friday - 194 points; Monday - 134 points; Tuesday - 127 points.
APRIL: Wednesday - 136 points; Thursday - 147 points; Friday - 91 points; Monday - 67 points; Tuesday - 142 points; Wednesday - 72 points; Thursday - 110 points; Friday - 33 points; Monday - 74 points; Tuesday - 84 points; Wednesday - 134 points; Thursday - 95 points; Friday - 80 points; Monday - 55 points; Tuesday - 64 points; Wednesday - 82 points; Thursday - 90 points; Friday - 101 points; Monday - 49 points; Tuesday - 79 points; Wednesday - 68 points; Thursday - 139 points.
MAY: Friday - 83 points; Monday - 79 points; Tuesday - 100 points; Wednesday - 63 points; Thursday - 67 points; Friday - 60 points; Monday - 51 pips
The average daily indicator, relative to the dynamics of volatility, is 84 points [see table of volatility at the end of the article].
As discussed in the previous review, traders tried to work on a downward movement after consolidation below 1.0775, but failed.
Analyzing the daily chart, we can see a global downward trend, where a series of successive fluctuations was formed.
Yesterday's news did not contain valuable statistics for Europe and the United States. Thus, all attention was focused on the information background.
Fed members have repeatedly shaken the public with their pessimistic attitude about the effects of the COVID-19 virus on the economy. But this time, Neel Kashkari, head of the Federal Reserve Bank of Minneapolis, stood out, as he stated that unemployment rate in the US could reach 23%, and other terrible situations are ahead.
Such comments frightened investors. In addition, Fed chairman Jerome Powell is scheduled to make a speech tomorrow, in which he will announce further measures to support the economy, doubling the fears of traders. FOMC members James Bullard, Neel Kashkari, Patrick Harker and Randal Quarles will also make a speech today.
Data on US inflation will be published today, where a decline from 1.5% to 0.5% is expected. This decrease in inflation may push the Fed to adopt new measures, such as decreasing the refinancing rate.
Further development
Analyzing the current trading chart, we can see a price movement within the levels of 1.0775 and 1.0850, where activity is still low. Quotes are currently waiting, and its movement may play in the hands of the upcoming acceleration. Thus, carefully analyze the consolidation points, working both on local and main positions.
An existing stop may focus on speculative activity, which will have a sharp impact on volatility.
Price fluctuations within the 1.0775 / 1.0850 level may remain in the market, where downward development is still considered as the main tactic for consolidation below 1.0765 / 1.0775. Such case will update April 24's low, and descend quotes to the level of 1.0700. An alternative scenario is trading within an existing corridor, and consolidation above 1.0860 in the four-hour period.
Based on the information above, we formulated these trading recommendations:
- Open sell positions below 1.0765, targeting the level of 1.0700.
- Open buy positions above 1.0835, targeting the level of 1.0860. The next goal is a price consolidation above the level of 1.0860 on the H4 chart.
Indicator analysis
Analyzing the different sector of time frames (TF), we can see that the hourly and daily periods indicate a bearish mood, which reflects the general background. Sell positions are recommended.
Volatility per week / Measurement of volatility: Month; Quarter; Year
The volatility measurement reflects the average daily fluctuation calculated per Month / Quarter / Year.
(May 12 was built, taking into account the time of publication of the article)
Volatility is currently 43 points, which is literally half lower than the daily average. Acceleration is still possible if quotes leave the established framework.
Key levels
Resistance zones: 1.0850 **; 1.0885 *; 1,1000 ***; 1.1080 **; 1,1180; 1.1300; 1.1440; 1.1550; 1.1650 *; 1.1720 **; 1.1850 **; 1,2100
Support Areas: 1.0775 *; 1.0650 (1.0636); 1,0500 ***; 1.0350 **; 1,0000 ***.
* Periodic level
** Range Level
*** Psychological level


