signal strength 1 of 5
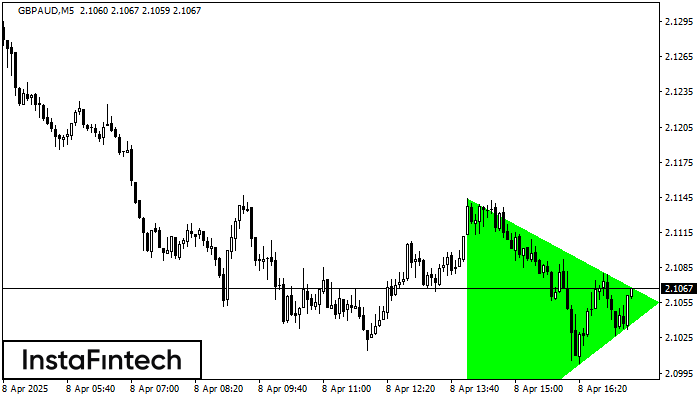
According to the chart of M5, GBPAUD formed the Bullish Symmetrical Triangle pattern. The lower border of the pattern touches the coordinates 2.0928/2.1055 whereas the upper border goes across 2.1144/2.1055. If the Bullish Symmetrical Triangle pattern is in progress, this evidently signals a further upward trend. In other words, in case the scenario comes true, the price of GBPAUD will breach the upper border to head for 2.1070.
The M5 and M15 time frames may have more false entry points.
- All
- Double Top
- Flag
- Head and Shoulders
- Pennant
- Rectangle
- Triangle
- Triple top
- All
- #AAPL
- #AMZN
- #Bitcoin
- #EBAY
- #FB
- #GOOG
- #INTC
- #KO
- #MA
- #MCD
- #MSFT
- #NTDOY
- #PEP
- #TSLA
- #TWTR
- AUDCAD
- AUDCHF
- AUDJPY
- AUDUSD
- EURCAD
- EURCHF
- EURGBP
- EURJPY
- EURNZD
- EURRUB
- EURUSD
- GBPAUD
- GBPCHF
- GBPJPY
- GBPUSD
- GOLD
- NZDCAD
- NZDCHF
- NZDJPY
- NZDUSD
- SILVER
- USDCAD
- USDCHF
- USDJPY
- USDRUB
- All
- M5
- M15
- M30
- H1
- D1
- All
- Buy
- Sale
- All
- 1
- 2
- 3
- 4
- 5
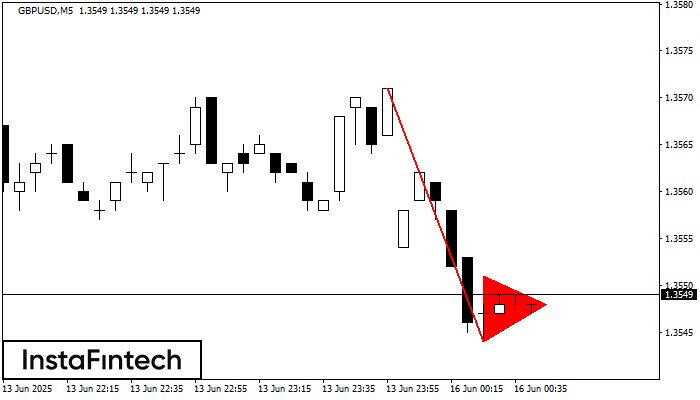
Pola Panji Bearish telah terbentuk di grafik GBPUSD M5. Jenis pola ini memiliki ciri sedikit perlambatan yang setelahnya harga akan bergerak ke arah tren sebenarnya. Jika harga ditetapkan di bawah
Rangka waktu M5 dan M15 mungkin memiliki lebih dari titik entri yang keliru.
Open chart in a new window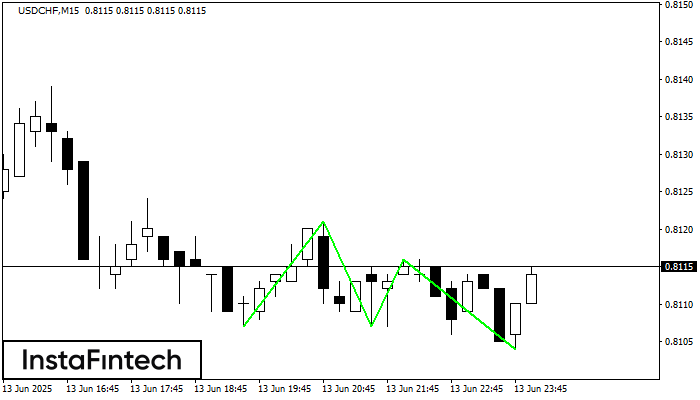
Pola Bawah Triple telah terbentuk pada grafik USDCHF M15. Fitur-fitur pola: garis bawah pola memiliki koordinat 0.8121 dengan batas atas 0.8121/0.8116, proyeksi lebar adalah 14 poin. Pembentukan pola Bawah Triple
Rangka waktu M5 dan M15 mungkin memiliki lebih dari titik entri yang keliru.
Open chart in a new window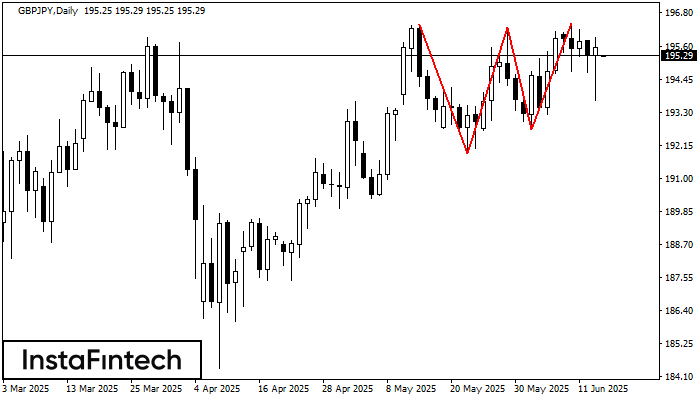
Pola Teratas Triple telah terbentuk pada grafik GBPJPY D1. Fitur-fitur pola: perbatasan memiliki sudut yang naik; batas bawah pola memiliki koordinat 191.87/192.70 dengan batas atas 196.38/196.42; proyeksi lebar adalah
Open chart in a new window