signal strength 1 of 5

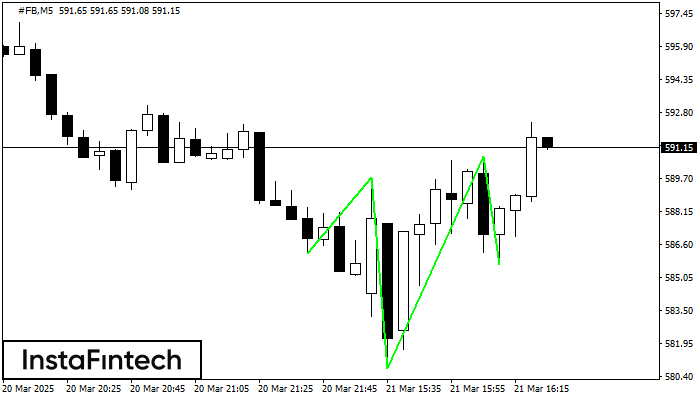
According to the chart of M5, #FB formed the Inverse Head and Shoulder pattern. The Head’s top is set at 590.72 while the median line of the Neck is found at 580.77/585.68. The formation of the Inverse Head and Shoulder pattern evidently signals a reversal of the downward trend. In other words, in case the scenario comes true, the price of #FB will go towards 590.87
The M5 and M15 time frames may have more false entry points.
Lihat juga
- All
- Double Top
- Flag
- Head and Shoulders
- Pennant
- Rectangle
- Triangle
- Triple top
- All
- #AAPL
- #AMZN
- #Bitcoin
- #EBAY
- #FB
- #GOOG
- #INTC
- #KO
- #MA
- #MCD
- #MSFT
- #NTDOY
- #PEP
- #TSLA
- #TWTR
- AUDCAD
- AUDCHF
- AUDJPY
- AUDUSD
- EURCAD
- EURCHF
- EURGBP
- EURJPY
- EURNZD
- EURRUB
- EURUSD
- GBPAUD
- GBPCHF
- GBPJPY
- GBPUSD
- GOLD
- NZDCAD
- NZDCHF
- NZDJPY
- NZDUSD
- SILVER
- USDCAD
- USDCHF
- USDJPY
- USDRUB
- All
- M5
- M15
- M30
- H1
- D1
- All
- Buy
- Sale
- All
- 1
- 2
- 3
- 4
- 5
Menurut Grafik dari M5, GBPUSD dibentuk pola Segitiga Simetris Bearish. Pola ini mengisyaratkan tren penurunan lebih lanjut jika terdapat batas yang lebih rendah 1.3524 ditembus. Disini, sebuah keuntungan hipotetis akan
Rangka waktu M5 dan M15 mungkin memiliki lebih dari titik entri yang keliru.
Open chart in a new windowPola Panji Bearish telah terbentuk di grafik Panji Bearish. Pola ini memberikan sinyal kelanjutan tren menurun jika titik terendah panji, di 2.0808 ditembus. Rekomendasi: Tempatkan sell stop pending order
Rangka waktu M5 dan M15 mungkin memiliki lebih dari titik entri yang keliru.
Open chart in a new windowPola Bawah Ganda telah terbentuk pada AUDCHF M30; batas atas di 0.5251; batas bawah di 0.5241. Lebar pola sebesar 11 poin. Jika harga menembus batas atas 0.5251, Perubahan dalam tren
Open chart in a new window