Riwayat kesuksesan dari tim yang dipimpin oleh Ales Loprais dapat menjadi riwayat kesuksesan anda! Trading dengan penuh percata diri dan menuju kepemimpinan seperti peserta pada umumnya dari Dakar Rally dan pemenang dari Silk Way Rally InstaForex Loprais Team melakukannya!
Bergabung dan menang bersama InstaForex!
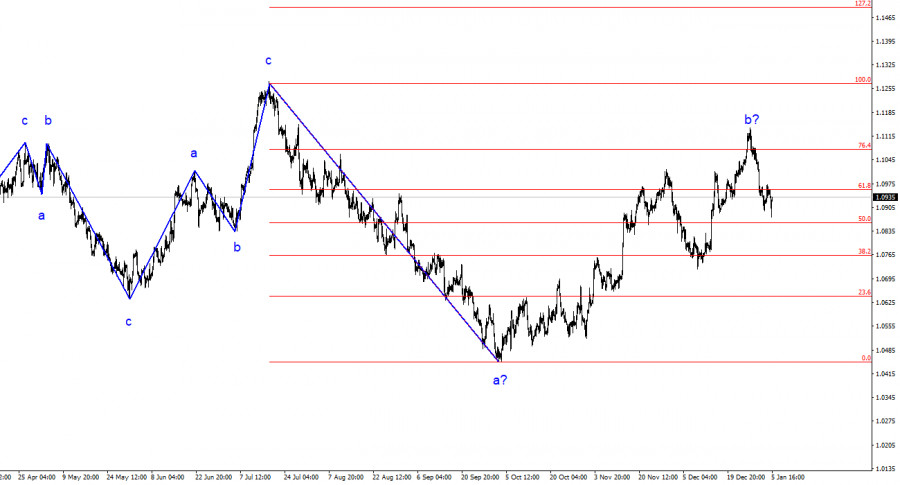
The wave analysis of the 4-hour chart for the euro/dollar pair has become more complex. Over the past year, we have observed only three wave structures that constantly alternate with each other. Currently, the construction of another three-wave decline continues. The presumed wave 1 has been completed, but wave 2 or b has become more complex three or four times, and there are no guarantees that it won't become even more complex.
Although the news background cannot be considered "supportive of the European currency," the market always finds new reasons to increase demand for the pair. Such a situation is not normal. Even if the upward segment of the trend resumes, its internal structure will become completely unreadable.
The internal wave analysis of the presumed wave 2 or b has changed. Since the last downward wave turned out to be disproportionately large, I now interpret it as a wave b. If this is the case, wave c is currently being constructed, and the entire wave 2 or b can still end at any moment (or may have already ended). The current retreat from the reached highs looks convincing, so we can expect a transition to wave 3 or c construction.
Eurozone inflation followed Germany's lead.
On Friday, the euro/dollar currency pair saw a 20 basis point decline. However, such a statement should not confuse my readers – during the day, the amplitude of movements was quite high, and quotes changed direction several times. In the first half of the day, there was a decline. As expected, the report on European inflation showed an acceleration in the pace of price growth, but it was less than anticipated. The market's expectation-to-reality mismatch was only 0.1%: 2.9% y/y vs. 3.0% y/y.
However, technically, inflation accelerated less, which implies a drop in the euro since the market expected more. If inflation had risen by more than 3%, it would have meant that the ECB would postpone the start of the monetary policy tightening procedure indefinitely. The rise in inflation to 2.9% essentially means the same thing, but here, the expectation-to-reality ratio played a role. Since reality turned out to be less severe, the market had a reason to reduce demand for the euro.
A couple of hours ago, the Nonfarm Payrolls and unemployment reports were released in America. These two reports can unequivocally be considered in favor of the dollar, but the market again failed or did not want to support the construction of a potential wave 3 or c. The US dollar rose for a very short period, then immediately retreated. An unsuccessful attempt to break through the 1.0881 level, corresponding to 61.8% Fibonacci, played a role.
Based on the analysis conducted, the construction of a bearish wave set continues. The targets around the 1.0463 mark have been perfectly worked out, and an unsuccessful attempt to break this level indicated a transition to the construction of a corrective wave. Wave 2 or b has taken on a completed form, so I expect the construction of an impulsive downward wave 3 or c with a significant decline in the pair soon. The unsuccessful attempt to break through the 1.1125 level, corresponding to 23.6% Fibonacci, indicated the market's readiness for selling.
On the larger wave scale, we can see that the construction of corrective wave 2 or b continues, which is no longer than 61.8% Fibonacci from the first wave. As I have already mentioned, this is not critical, and the scenario with the construction of wave 3 or c and a decline in the pair below the 1.04 level remains in force.
Anda telah menyukai postingan ini hari ini
*Analisis pasar yang diposting disini dimaksudkan untuk meningkatkan pengetahuan Anda namun tidak untuk memberi instruksi trading.
Analisis: Struktur gelombang terbaru untuk GBP/USD, yang dimulai pada bulan Agustus tahun lalu, masih belum lengkap dan sedang menurun. Bagian ini berfungsi sebagai koreksi dalam gelombang yang lebih besar. Selama
Euro kemungkinan akan melanjutkan pergerakan menyamping secara keseluruhan dalam minggu mendatang. Selama beberapa hari ke depan, mungkin ada tekanan pada zona support, dengan kemungkinan terjadi penembusan singkat di bawah batas
Analisis: Pada grafik pound sterling utama, tren jangka pendek sejak musim panas lalu telah ditentukan oleh algoritma gelombang menurun. Struktur gelombang ini tampaknya belum selesai hingga saat ini. Kuotasi mendekati
Analisis: Gelombang bearish dari mata uang euro, yang dimulai pada bulan Agustus tahun lalu, telah mencapai batas atas zona target awal. Struktur dari seluruh gelombang ini tampaknya belum selesai berdasarkan
Analisis: Tren jangka pendek dominan dari pasangan EUR/USD telah ditentukan oleh wave menurun sejak akhir Agustus. Wave korektif telah berkembang sejak akhir November dalam bentuk pola datar bergeser, yang masih
Analisis Singkat: Sejak akhir Agustus, pound Inggris telah membentuk wave bearish terhadap dolar AS, yang melemahkan posisinya. Segmen ini adalah bagian dari wave korektif yang lebih besar. Selama tiga minggu
Your IP address shows that you are currently located in the USA. If you are a resident of the United States, you are prohibited from using the services of InstaFintech Group including online trading, online transfers, deposit/withdrawal of funds, etc.
If you think you are seeing this message by mistake and your location is not the US, kindly proceed to the website. Otherwise, you must leave the website in order to comply with government restrictions.
Why does your IP address show your location as the USA?
Please confirm whether you are a US resident or not by clicking the relevant button below. If you choose the wrong option, being a US resident, you will not be able to open an account with InstaForex anyway.
We are sorry for any inconvenience caused by this message.