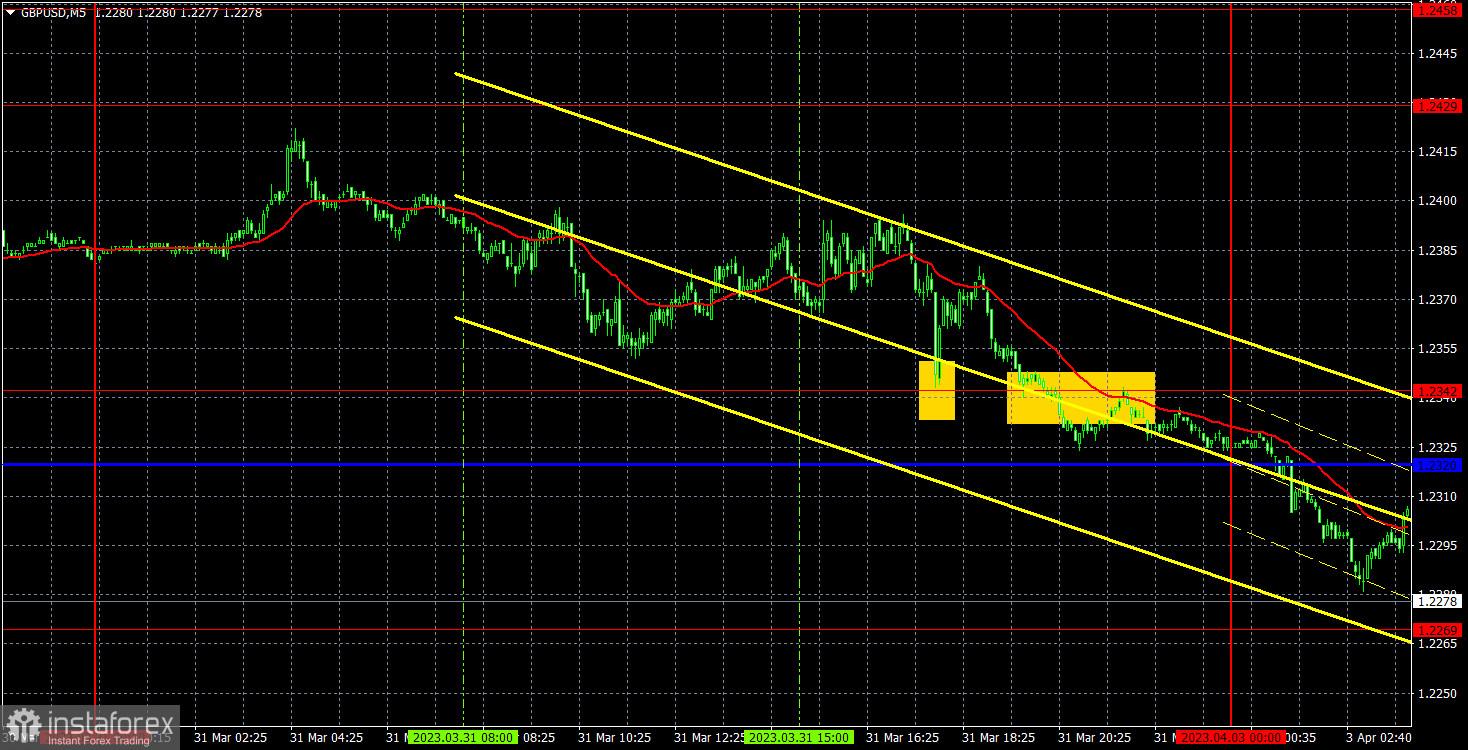
Analysis of GBP/USD on the 5-minute chart
On Friday, the pound/dollar pair started falling. However, it had fewer reasons for a drop than the euro/dollar pair. While the eurozone disclosed an important inflation report, the UK did not issue any significant data. The UK GDP report is of minor importance. What is more, it showed that the real data exceeded the forecast. That is why the pound sterling should have increased. The US also disclosed only insignificant reports. At the moment of their publication, traders showed local reaction but it could hardly be called logical. It is much more important that the pair was near the upper limit of the sideways channel on the daily chart. The pound sterling once again increased more than anticipated and without obvious reasons. The currency is still hovering in the sideways channel of the daily chart. This fact should have led to a decline or a further rise if the price exceeded 1.2440. Thus, we saw the first scenario.
On Friday, traders received just two trading signals. During the US trade, the pair rebounded from 1.2342 and climbed by 18 pips. That was not enough to place a stop loss order in the breakeven. However, traders should have closed the trade manually not to lose money. The second signal was formed almost at the end of the trading day. It was wise to ignore it.
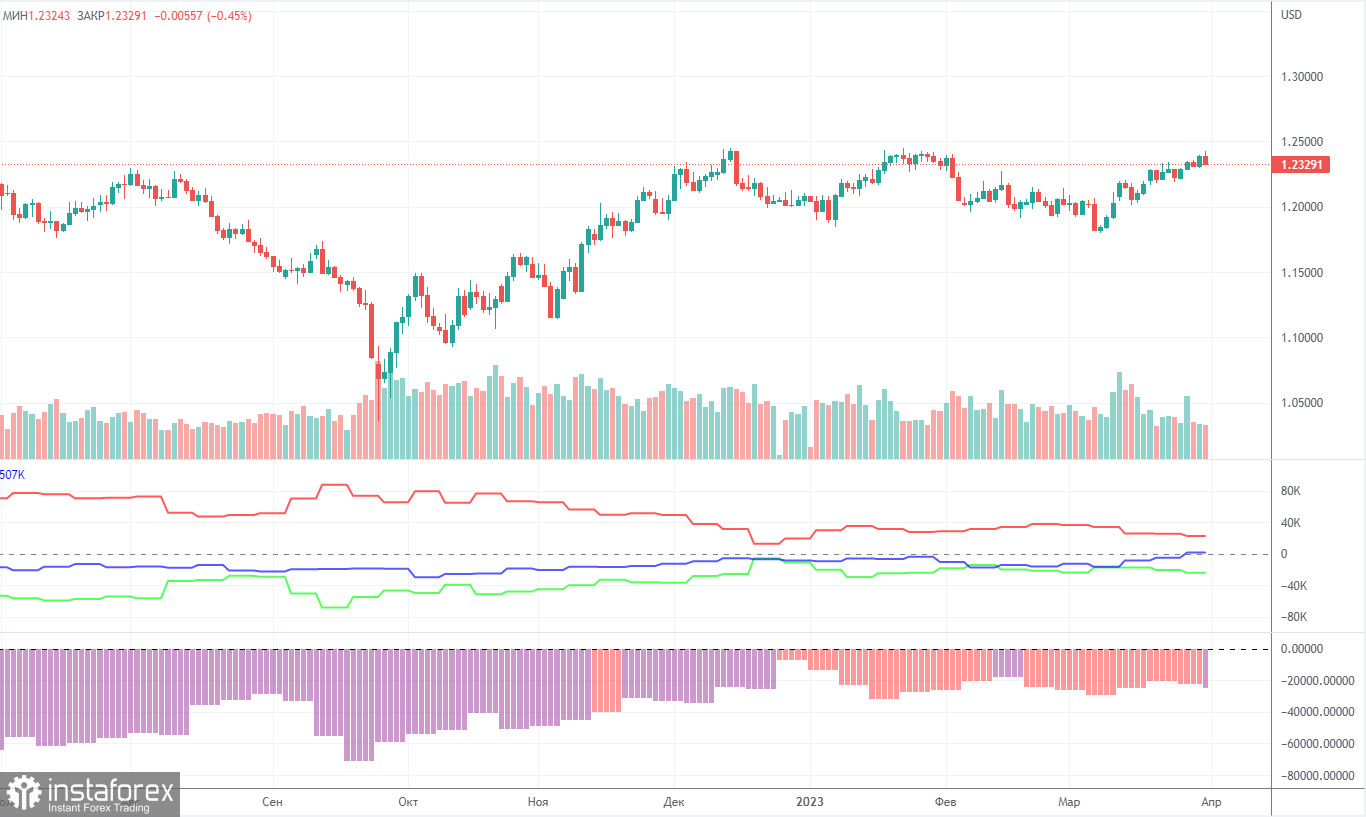
COT report.
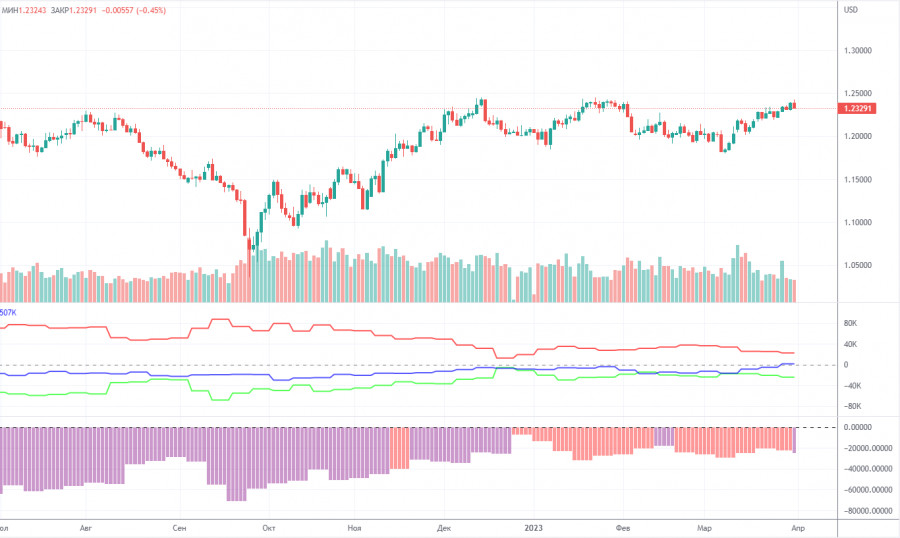
The COT reports on the British pound are again relevant. The recent one was issued on March 28. It showed that non-commercial traders closed 0.3 thousand buy orders and opened 3.3 thousand sell orders. Thus, the net position of non-commercial traders decreased by 3 thousand, without violating the general upward movement. The net position indicator has been steadily growing over the past 7-8 months but the sentiment of major players remains bearish. Although the pound sterling is growing against the US dollar (in the medium term), it is very difficult to explain this from a fundamental point of view. It is highly possible the pound will begin falling in the near future. Formally, it has already begun doing so since we have not seen a rise for three months already. So far, the movement looks more like a flat. Notably, both major pairs are moving about the same way now. However, the net position for the euro is positive and even implies the imminent completion of the upward momentum while for the pound sterling, it is negative, which allows us to bet on further growth. Notably, the British pound has already increased by 2,100 pips, which is a lot. What is more, without a strong downward correction, further growth will be absolutely illogical. The non-commercial group has opened a total of 52 thousand sell contracts and 28 thousand buy contracts. We remain skeptical about the long-term growth in the British currency and expect it to fall.
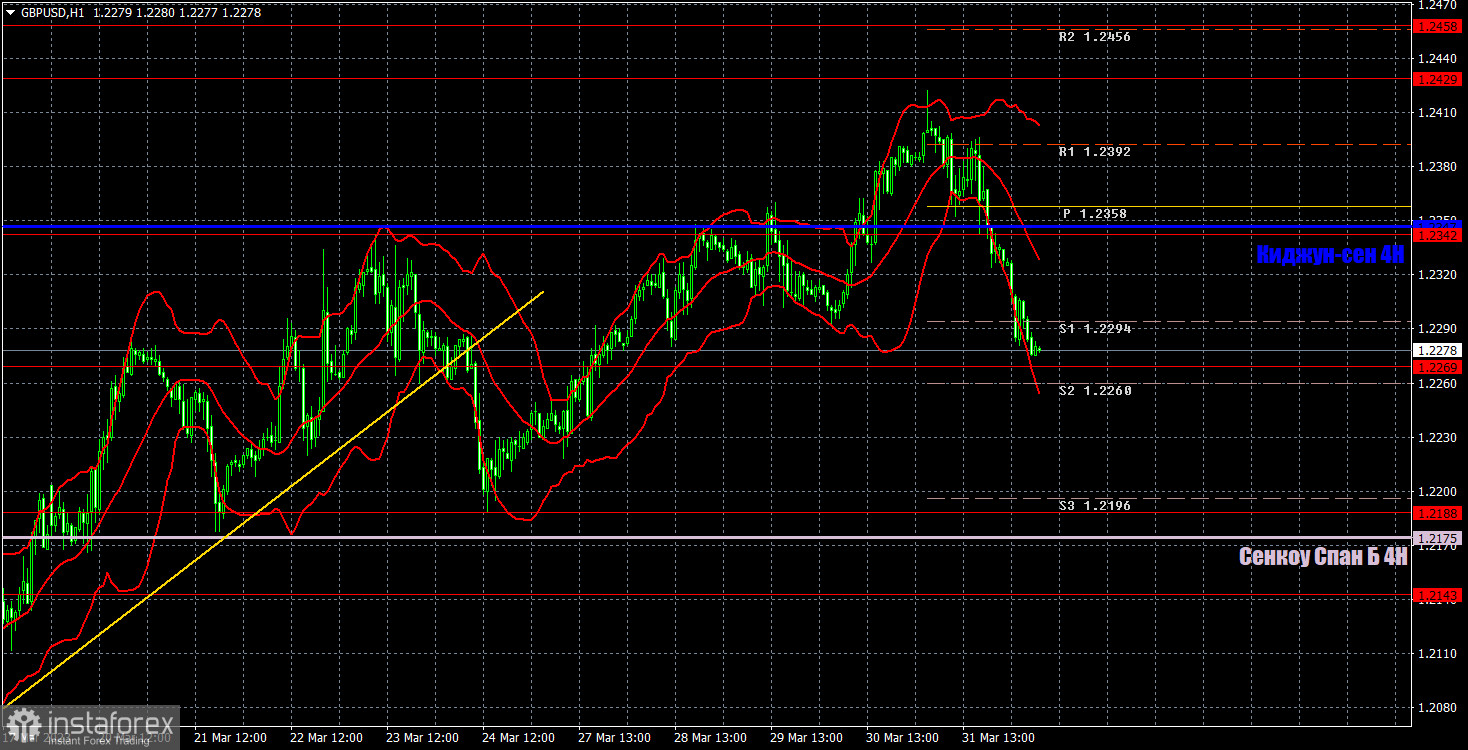
Analysis of GBP/USD on the one-hour chart
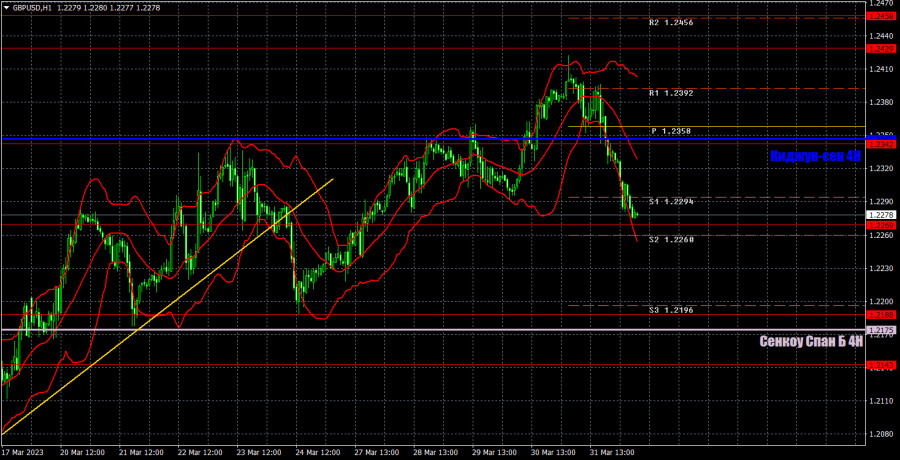
On the hourly chart, the pound/dollar pair is again trying to start a new downward trend. If traders do not find new reasons to buy the pound this week, the fall should continue. The nearest target is the Senkou Span B line but we expect a much stronger drop. On April 3, we highlight the following important levels: 1.1927, 1.1965, 1.2143, 1.2185, 1.2269, 1.2342, 1.2429-1.2458, 1.2589, 1.2659. The Senkou Span B (1.2175) and Kijun-sen (1.2347) lines may also give signals. Breakouts and rebounds from these levels could be used as signals. Do not forget to place a stop-loss order at breakeven if the price goes in the right direction by 20 pips. The lines of the Ichimoku indicator can move during the day, which should be taken into account when determining trading signals. On Monday, the UK will disclose data on the manufacturing PMI. The same report will be issued in the US. A reaction to these reports is unlikely to be strong and affect the overall market situation.
What we see on the trading charts:
Price levels of support and resistance are thick red lines, near which the movement may end. They do not provide trading signals.
The Kijun-sen and Senkou Span B lines are the lines of the Ichimoku indicator, moved to the one-hour chart from the 4-hour one. They are strong lines.
Extreme levels are thin red lines from which the price bounced earlier. They provide trading signals.
Yellow lines are trend lines, trend channels, and any other technical patterns.
Indicator 1 on the COT charts reflects the net position size of each category of traders.
Indicator 2 on the COT charts reflects the net position size for the non-commercial group.