Analysis of EUR/USD, 5M.

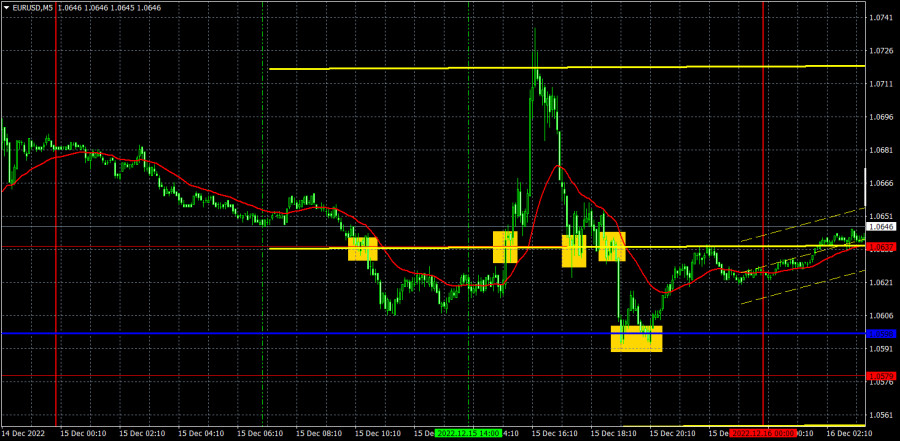
On Thursday, the EUR/USD pair was extremely volatile. As I mentioned earlier, the market reaction before the ECB and the Fed meetings could be rather sharp. Hence, I was not surprised by such price swings. Notably, the euro managed to retain a bullish bias despite an eventful week. It is trading in the bullish corridor although it rolled back slightly overnight. The euro did not slide below the pivot level, signaling a bearish sentiment. This is why the outlook is still bullish. There are also no sell signals. The results of the ECB meeting turned out to be more hawkish compared to the Fed and the BoE. Christine Lagarde said that the regulator is set to start the QT program in March of next year. The Fed and the BoA launched a similar program some time ago. She also stressed the need to raise the key rate higher than previously expected. "Europe is entering a difficult phase," Lagarde said. The regulator has to implement more effective tools to curb stubbornly high inflation. So, the fight against inflation is likely to be long. This is bullish for the euro.
On Thursday, there were many trading signals at 1.0637. As the ECB announced its key rate decision in the afternoon, traders were able to take advantage of the first entry point. The pair rose by about 20 pips. Speculators placed Stop Loss orders and avoided losses. After that, the pair got rather volatile and traders stayed away from the market.
COT report:

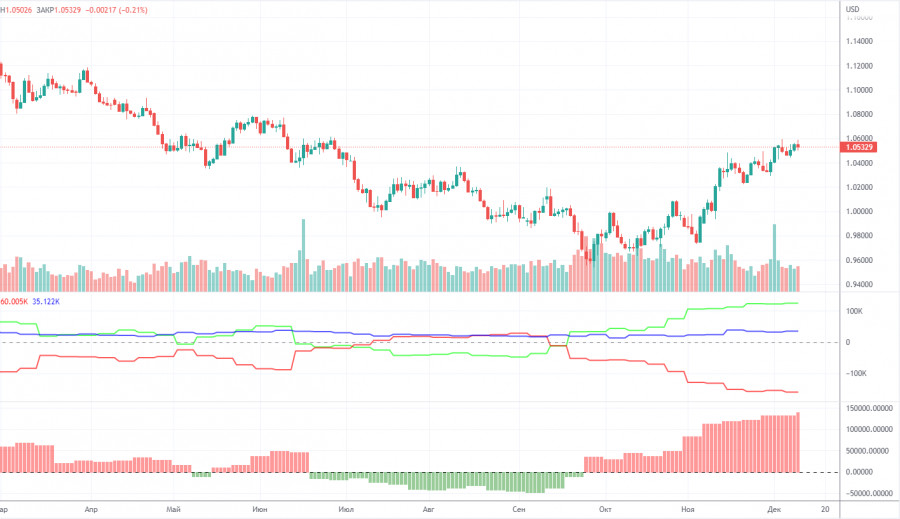
In 2022, the COT reports for the euro are becoming more and more interesting. In the first part of the year, the reports were pointing to the bullish sentiment among professional traders. However, the euro was confidently losing value. Then, for several months, reports were reflecting bearish sentiment and the euro was also falling. Now the net position of non-commercial traders is again bullish and strengthens almost every week. The euro is growing but a fairly high value of the net position may point to the end of the upward movement or at least, to a correction. During the given period, the number of buy positions opened by non-commercial traders increased by 3,900, whereas the number of short positions rose by 1,300. Thus, the net positions advanced by 2,600. Notably, the green and red lines of the first indicator have moved far apart from each other, which may mean the end of the ascending trend. The number of buy positions is 125,000 higher than the number of sell positions opened by non-commercial traders. Thus, the net position of the non-commercial group may continue to grow. However, the euro may remain unchanged. The overall number of short orders exceeds the number of long orders by 35,000 (661k vs. 626k).
Analysis of EUR/USD, 1H

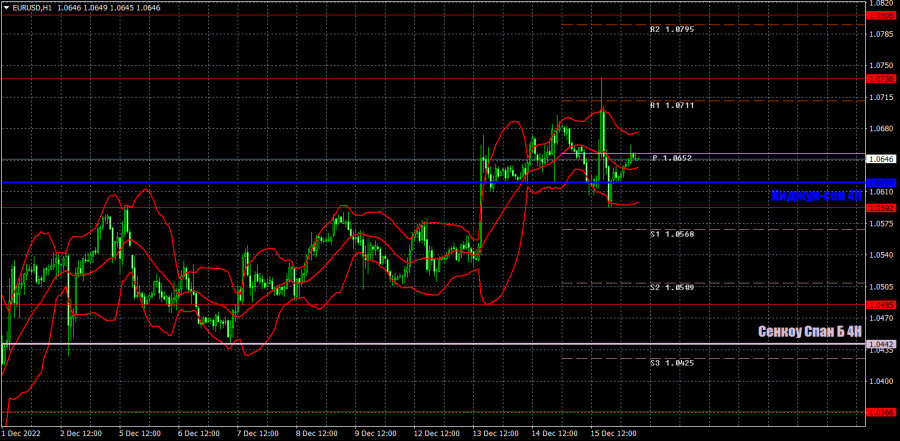
On the one-hour chart, the euro/dollar pair is still trading at its highs. The Fed's meeting and the speech provided by Jerome Powell failed to support the US dollar. The euro, on the contrary, climbed following the ECB meeting and Christine Lagarde's speech. The uptrend will prevail as long as the pair is trading above the pivot level. If bulls remain in control, the euro is likely to jump to new highs. Today, there are several entry points – 1.0340-1.0366, 1.0485, 1.0592, 1.0736, 1,0806, as well as the Senkou Span B (1.0442) and Kijun-sen (1.0620) lines. The lines of the Ichimoku indicator can move during the day, which should be taken into account when determining trading signals. Breakouts and rebounds from these levels could be used as signals. Do not forget to place a stop-loss order at breakeven if the price goes in the right direction by 15 pips. This will protect against possible losses if the signal turns out to be false. On December 16, the US and the EU Manufacturing and Services PMI Indices are on tap. All 6 indices are likely to remain below 50 as both economies are now slowing down. Therefore, market reaction to this data will hardly be strong.
Indicators on charts:
Resistance/support - thick red lines, near which the trend may stop. They do not make trading signals.
The Kijun-sen and Senkou Span B lines are the Ichimoku indicator lines moved to the hourly timeframe from the 4-hour timeframe. They are also strong lines.
Extreme levels are thin red lines from which the price bounced earlier. They provide trading signals.
Yellow lines are trend lines, trend channels, and any other technical patterns.
Indicator 1 on the COT charts reflects the net position size of each category of traders.
Indicator 2 on the COT charts reflects the net position size for the non-commercial group of traders.


