Analysis of Thursday's trades:
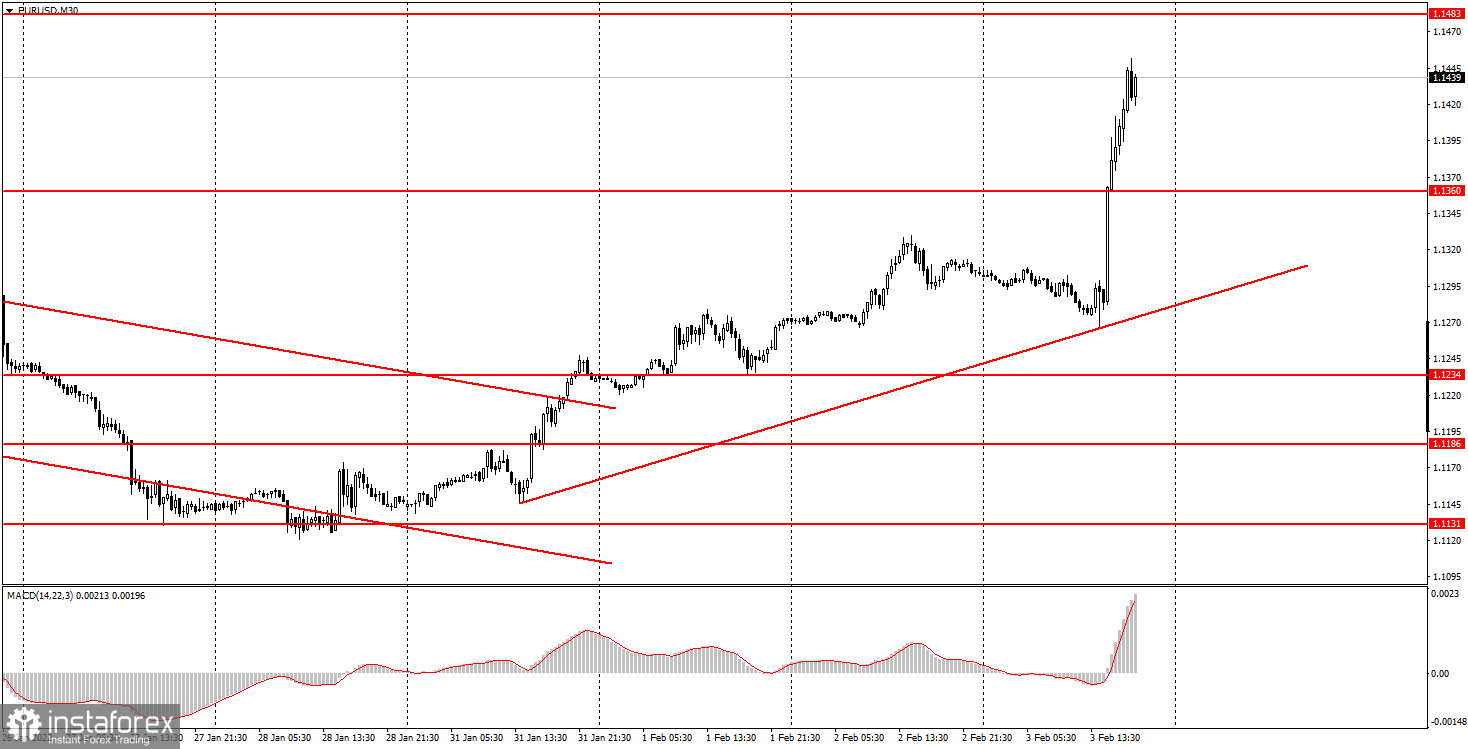
EUR/USD 30M chart
On Thursday, February 3rd, the EUR/USD pair was extremely volatile. During the day the pair added nearly 200 pips, hitting multi-year highs. And it's not just a metaphor. It goes without saying that the upward tendency prevailed on the 30M time frame. Besides, an upward trend line has been formed which serves as a pivot now. The most interesting thing in this story is the reason behind the euro's 2-cent surge against the US dollar. In short, the reason was the same as three weeks ago when the single currency was also demonstrating robust growth. In particular, there was no solid reason. It may sound rather strange, but there have been no macroeconomic statistics, fundamental factors, or mere expectations of some important events that could support the euro. So, the uptrend arose out of nowhere. Today the European Central Bank refrained from taking any crucial decisions and made no adjustments to its monetary policy. Indeed, the EUR bullish run was not backed by anything.
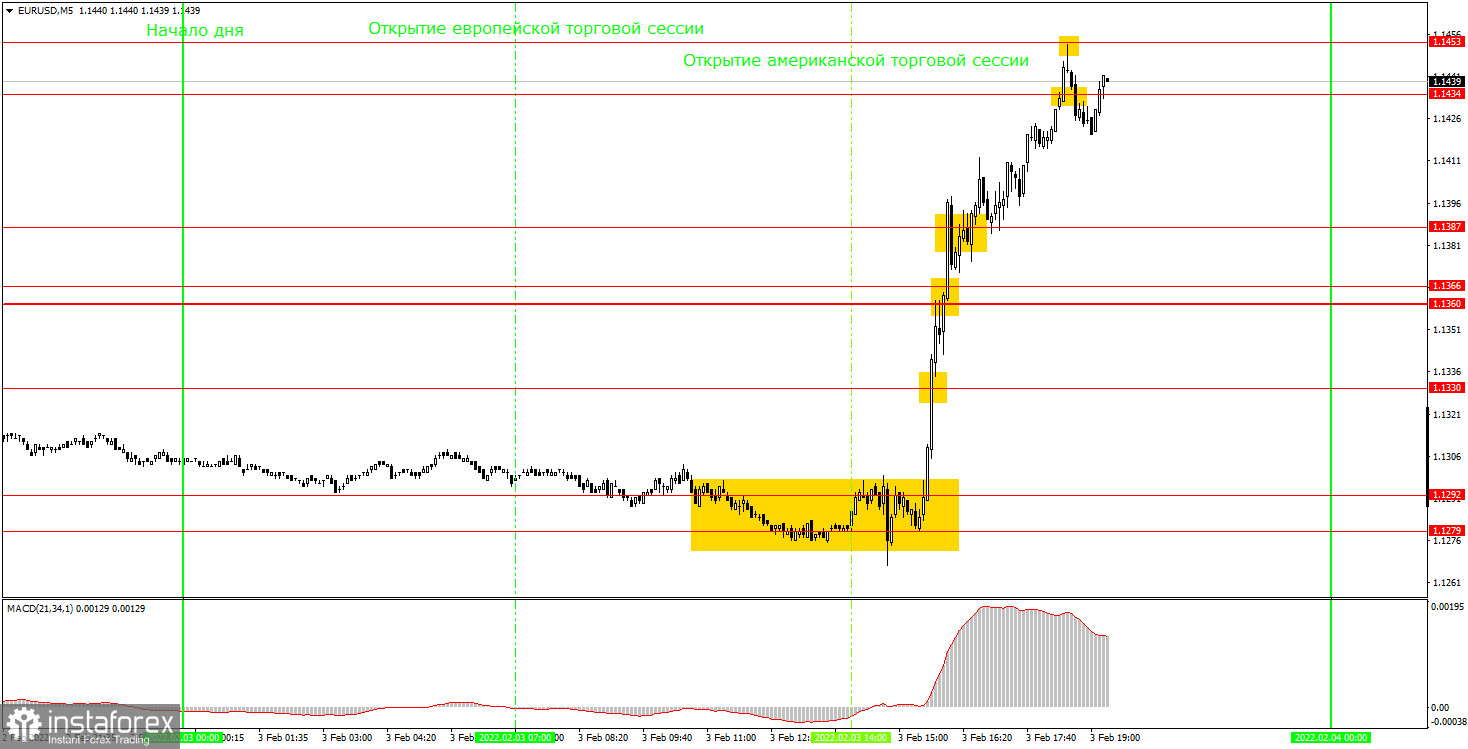
EUR/USD 5M chart
The 5M time frame chart looks really impressive. The movements became active in the course of the American session, after Christine Lagarde's speech. Before that, the pair was fluctuating in the support zone between 1.1279 and 1.1292. The price rebounded from this area and started rising rapidly. It easily broke the levels of 1.1330, 1.1360-1.1366, 1.1387, 1.1434, staying near 1.1453. Only those beginning traders were able to benefit from this surge who took a risk of buying EUR upon a break of 1,1330. A rebound from 1.1279-1.1292 was not accurate and occurred at the very moment when Christine Lagarde started speaking. So, it was highly possible that the trend could reverse to the downside unexpectedly. That's why it was risky to open positions at that moment. Similarly, it was risky to open trades near 1.1330, but by that time, we could expect that the market digested the ECB meeting results and therefore took some definite direction. However, the results were nothing peculiar as I've already mentioned.
Trading plan for Friday, February 4th:
In the 30M time frame, the upward tendency seems to be sustainable. But I don't think this week's developments were anything extraordinary. Probably, the pair will start declining in the coming weeks for no reason at all. Anyway, we need to wait until the 4-day market turmoil calms down after the ECB meeting. The target levels in the 5M time frame can be found at 1.1360-1.1366, 1.1387, 1.1434, 1.1453, 1.1478, 1.1496, and 1.1513. On Friday, the eurozone will release a retail sales report which is of minor importance. Probably, traders will barely notice it. At the same time, the United States will unveil some rather important reports tomorrow. Namely, the Unemployment data, the Wages statistics, and the Non-Farm Payrolls report can fuel high volatility. The closest attention will be paid to the Non-Farm Payrolls figures.
The basic principles of a trading system
1) The strength of the signal depends on the time period during which the signal was formed (a rebound or a break). The shorter this period, the stronger the signal.
2) If two or more trades were opened at some level following false signals, then any consequent signals near this level should be ignored.
3) During the flat trend, any currency pair may form a lot of false signals or do not produce any signals at all. In any case, the flat trend is not the best condition for trading.
4) Trades are opened in the time period between the beginning of the European session and until the middle of the American one when all deals should be closed manually.
5) We can pay attention to the MACD signals in the 30M time frame only if there is good volatility and a definite trend confirmed by a trend line or a trend channel.
6) If two key levels are too close to each other (about 5-15 pips), then this is a support or resistance area.
How to read a chart:
Support and Resistance price levels can serve as targets when buying or selling. You can place Take Profit levels near them.
Red lines are channels or trend lines that display the current trend and show which direction is better to trade.
MACD indicator (14,22,3) is a histogram and a signal line that can also serve as a source of signals.
Important speeches and reports that are always reflected in the economic calendars can greatly influence the movement of a currency pair. Therefore, during such events, it is recommended to trade as carefully as possible or exit the market in order to avoid a sharp price reversal against the previous movement.
Beginning traders should remember that every trade cannot be profitable. The development of a reliable strategy and money management are the key to success in trading over a long period of time.