empty
29.11.2022 10:20 AM
Technical Analysis of GBP/USD for November 29, 2022

Technical Market Outlook:

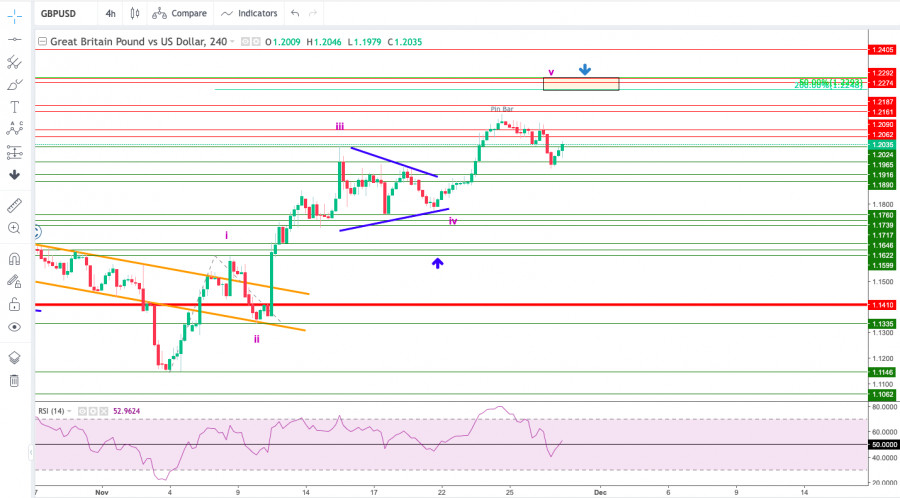
The GBP/USD pair has made another higher high at the H4 time frame chart located at 1.2154. Currently, the market is making the wave v of the overall cycle and the target for this wave is located at 1.2248, so there is less than 100 pips away. The 50% Fibonacci retracement of the whole big wave down is seen at 1.2293, so the up move might extend towards this level as well. The key intraday technical support was seen at 1.2024 and this level was violated already as the pull-back from highs extends towards the technical support seen at 1.2000 and 1.1916.

This image is no longer relevant

Weekly Pivot Points:

WR3 - 1.21733

WR2 - 1.21168

WR1 - 1.20955

Weekly Pivot - 1.20603

WS1 - 1.20390

WS2 - 1.20038

WS3 - 1.19473

Trading Outlook:

The bulls are temporary in control of the market and the 50% Fibonacci retracement of the last big wave down located at 1.2293 might be tested soon. On the other hand, the level of 1.0351 has not been tested since 1985, so the down trend is strong. In order to terminate the down trend, bulls need to close the weekly candle above the level of 1.2275 (swing high from August 10th).

Select timeframe
5
min
15
min
30
min
1
hour
4
hours
1
day
1
week
Earn on cryptocurrency rate changes with InstaForex
Download MetaTrader 4 and open your first trade
  • Grand Choice
    Contest by
    InstaForex
    InstaForex always strives to help you
    fulfill your biggest dreams.
    JOIN CONTEST

Recommended Stories

Forecast for EUR/USD on January 8, 2025

Yesterday, the US dollar increased by 0.39%, while the euro decreased by 0.47%. This movement occurred alongside a 1.10% drop in the US S&P 500 stock index. The significant decline

Laurie Bailey 04:04 2025-01-08 UTC+2

Forecast for GBP/USD on January 8, 2025

Yesterday, the British pound pierced the balance line on the daily chart with its upper shadow and then turned downward along with the broader market. The signal line

Laurie Bailey 04:04 2025-01-08 UTC+2

Forecast for AUD/USD on January 8, 2025

On the weekly chart, the price continues to hover near the light lavender price channel line. It has the potential to reach the 158.66 level, although it may fall short

Laurie Bailey 04:04 2025-01-08 UTC+2

Trading Signals for EUR/USD for January 7-9, 2025: sell below 1.0430 (21 SMA - 200 EMA)

Early in the American session, the euro is trading around 1.0404, making a technical correction after an attempt to break the bearish trend channel but without success

Dimitrios Zappas 14:49 2025-01-07 UTC+2

Trading Signals for GOLD (XAU/USD) for January 7-9, 2025: buy above, $2,641 (21 SMA - 200 EMA)

The key level to pay attention to is 2,641. Any technical bounce above this area will be seen as a bullish signal. On the contrary, below this area, gold could

Dimitrios Zappas 14:48 2025-01-07 UTC+2

EUR/USD: January 7 - German Inflation Report Changes the Game

On Monday, the EUR/USD pair continued its upward movement, which traders had not anticipated. The pair consolidated above the resistance zone of 1.0336–1.0346 and reached the resistance zone of 1.0405–1.0420

Samir Klishi 12:54 2025-01-07 UTC+2

Forecast for GBP/USD on January 7, 2025

On the hourly chart, the GBP/USD pair continued its upward movement on Monday following a rebound from the support zone of 1.2363–1.2370, ending the day by consolidating above the 1.2488–1.2508

Samir Klishi 12:38 2025-01-07 UTC+2

Forex forecast 07/01/2025: EUR/USD, GBP/USD, Gold, Oil and Bitcoin

Video Agenda: 00:00 INTRO 00:13 Today's key events: Halifax House Price Index, CPI EU, ISM Non-Manufacturing PMI, JOLTS Job Openings 02:32 EUR/USD 04:26 GBP/USD 06:09 GOLD 08:25 OIL 10:36 BTC/USD

Sebastian Seliga 10:31 2025-01-07 UTC+2

Technical Analysis of Intraday Price Movement of AUD/USD Commodity Currency Pairs, Tuesday January 07, 2025.

If we look at the 4-hour chart of the AUD/USD commodity currency pair, we can see several interesting things, namely, first, the appearance of a Bullish 123 pattern followed

Arief Makmur 05:57 2025-01-07 UTC+2

Technical Analysis of Intraday Price Movement of Platinum Commodity Asset, Tuesday January 07, 2025.

From what we can see on the 4-hour chart of the Platinum commodity asset, there appears to be an Equal High in the form of a Double Top (yellow circle)

Arief Makmur 05:57 2025-01-07 UTC+2
Can't speak right now?
Ask your question in the chat.
Widget callback
 

Dear visitor,

Your IP address shows that you are currently located in the USA. If you are a resident of the United States, you are prohibited from using the services of InstaFintech Group including online trading, online transfers, deposit/withdrawal of funds, etc.

If you think you are seeing this message by mistake and your location is not the US, kindly proceed to the website. Otherwise, you must leave the website in order to comply with government restrictions.

Why does your IP address show your location as the USA?

  • - you are using a VPN provided by a hosting company based in the United States;
  • - your IP does not have proper WHOIS records;
  • - an error occurred in the WHOIS geolocation database.

Please confirm whether you are a US resident or not by clicking the relevant button below. If you choose the wrong option, being a US resident, you will not be able to open an account with InstaForex anyway.

We are sorry for any inconvenience caused by this message.