

Actual patterns
Patterns are graphical models which are formed in the chart by the price. According to one of the technical analysis postulates, history (price movement) repeats itself. It means that the price movements are often similar in the same situations which makes it possible to predict the further development of the situation with a high probability.
Actual Patterns
- All
- Double Top
- Flag
- Head and Shoulders
- Pennant
- Rectangle
- Triangle
- Triple top
- All
- #AAPL
- #AMZN
- #Bitcoin
- #EBAY
- #FB
- #GOOG
- #INTC
- #KO
- #MA
- #MCD
- #MSFT
- #NTDOY
- #PEP
- #TSLA
- #TWTR
- AUDCAD
- AUDCHF
- AUDJPY
- AUDUSD
- EURCAD
- EURCHF
- EURGBP
- EURJPY
- EURNZD
- EURRUB
- EURUSD
- GBPAUD
- GBPCHF
- GBPJPY
- GBPUSD
- GOLD
- NZDCAD
- NZDCHF
- NZDJPY
- NZDUSD
- SILVER
- USDCAD
- USDCHF
- USDJPY
- USDRUB
- All
- M5
- M15
- M30
- H1
- D1
- All
- Buy
- Sale
- All
- 1
- 2
- 3
- 4
- 5
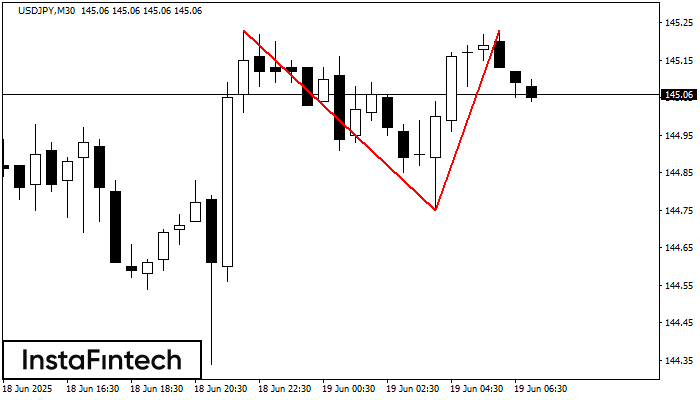
On the chart of USDJPY M30 the Double Top reversal pattern has been formed. Characteristics: the upper boundary 145.23; the lower boundary 144.75; the width of the pattern 48 points
Open chart in a new window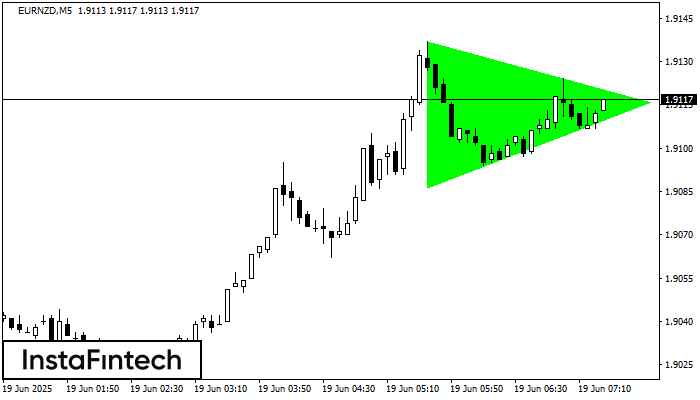
According to the chart of M5, EURNZD formed the Bullish Symmetrical Triangle pattern, which signals the trend will continue. Description. The upper border of the pattern touches the coordinates 1.9137/1.9116
The M5 and M15 time frames may have more false entry points.
Open chart in a new window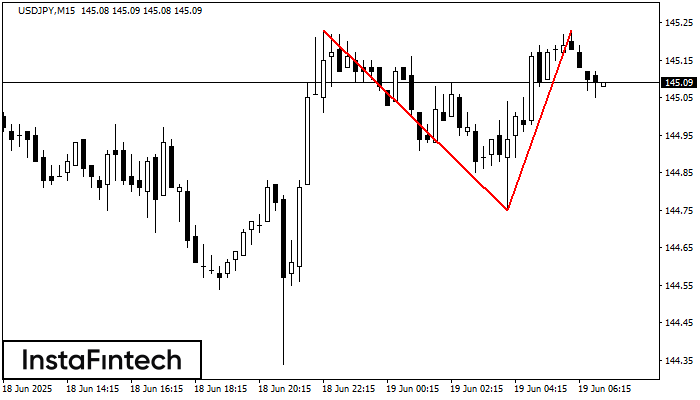
The Double Top pattern has been formed on USDJPY M15. It signals that the trend has been changed from upwards to downwards. Probably, if the base of the pattern 144.75
The M5 and M15 time frames may have more false entry points.
Open chart in a new window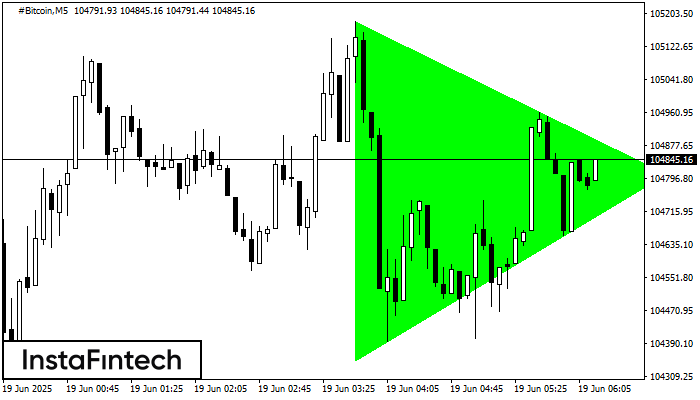
According to the chart of M5, #Bitcoin formed the Bullish Symmetrical Triangle pattern. Description: This is the pattern of a trend continuation. 105184.86 and 104346.67 are the coordinates
The M5 and M15 time frames may have more false entry points.
Open chart in a new window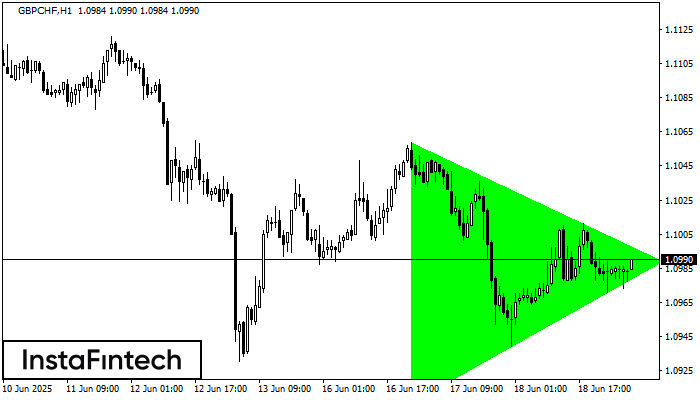
According to the chart of H1, GBPCHF formed the Bullish Symmetrical Triangle pattern, which signals the trend will continue. Description. The upper border of the pattern touches the coordinates 1.1059/1.0989
Open chart in a new window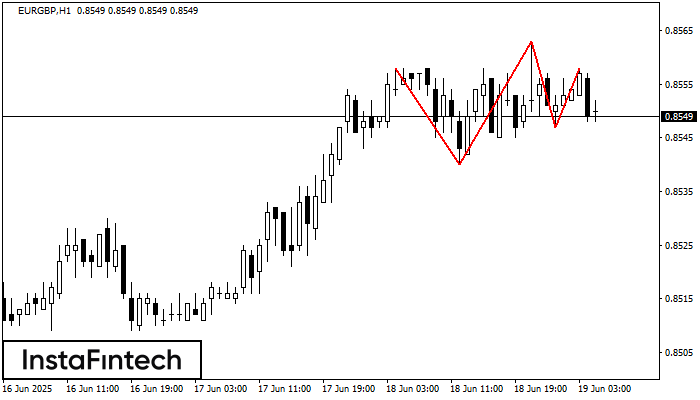
The Triple Top pattern has formed on the chart of the EURGBP H1. Features of the pattern: borders have an ascending angle; the lower line of the pattern
Open chart in a new window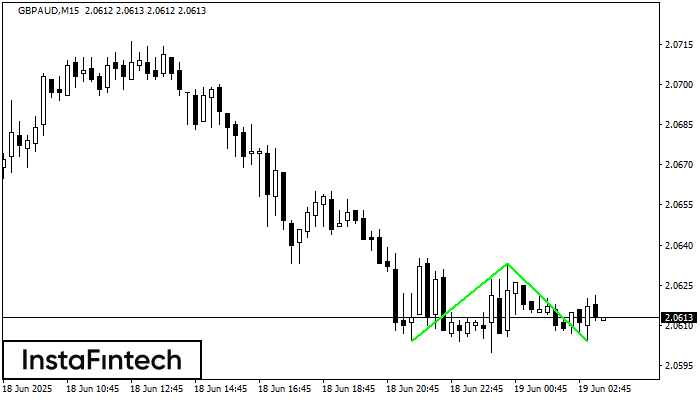
The Double Bottom pattern has been formed on GBPAUD M15. Characteristics: the support level 2.0604; the resistance level 2.0633; the width of the pattern 29 points. If the resistance level
The M5 and M15 time frames may have more false entry points.
Open chart in a new window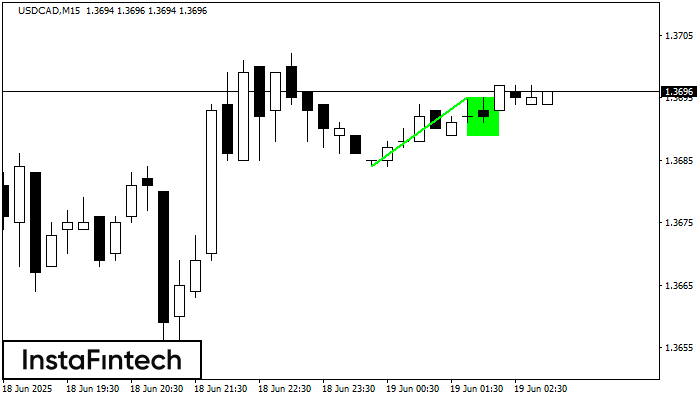
The Bullish Flag pattern has been formed on USDCAD at M15. The lower boundary of the pattern is located at 1.3689/1.3689, while the higher boundary lies at 1.3695/1.3695. The projection
The M5 and M15 time frames may have more false entry points.
Open chart in a new window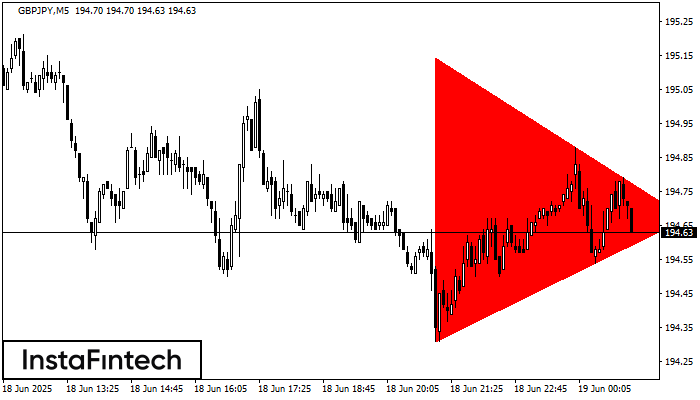
According to the chart of M5, GBPJPY formed the Bearish Symmetrical Triangle pattern. Description: The lower border is 194.31/194.67 and upper border is 195.14/194.67. The pattern width is measured
The M5 and M15 time frames may have more false entry points.
Open chart in a new window


