empty
13.12.2024 07:44 AM
Trading Recommendations and Review of GBP/USD on December 13; The Pound Sterling Gave In

GBP/USD 5-Minute Analysis

This image is no longer relevant

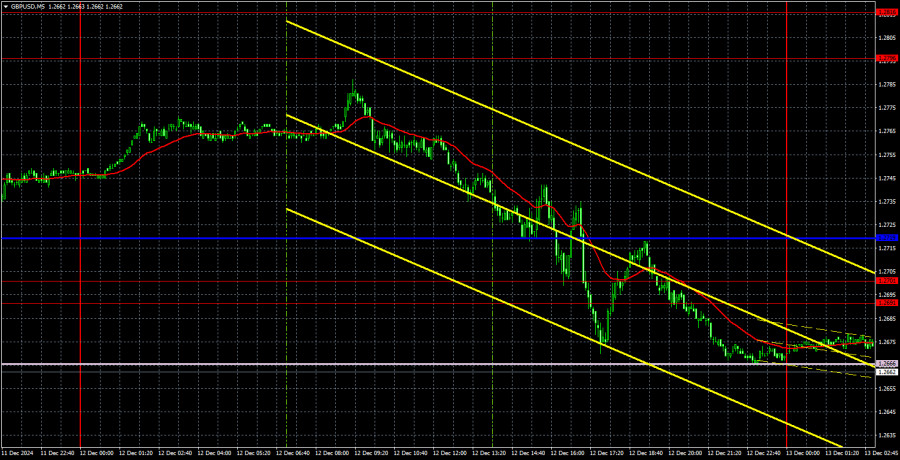
The GBP/USD currency pair experienced a significant decline on Thursday, dropping to the Senkou Span B line. Previously, the price had consolidated below the ascending trendline, signaling the potential end of the correction. Subsequently, the pair traded in a clear sideways movement for several days, but yesterday, without any strong reasons for a drop, the pair plunged downward. Interestingly, both the euro and the pound sterling fell to the Senkou Span B line. Today, the future movement of both pairs will depend on whether these lines are broken.

We have repeatedly mentioned the likelihood of the pound resuming its downtrend. As demonstrated, this did not require any new UK or US data. However, macroeconomic data from the US labor market turned out decent, and inflation showed slight growth. Consequently, based on the available factors, the pound's decline and the dollar's rise seemed inevitable. If the downtrend has resumed, we can expect further declines in the British currency in the near term, regardless of the news flow.

Unfortunately, yesterday's movements were quite challenging to capitalize on. The price came close to forming a sell signal near the 1.2796 level but missed it by just a few points. All other signals were formed within the 1.2666–1.2719 zone, which contained two levels and two lines. As a result, acting on these signals was impractical. Today, if the price consolidates below the Senkou Span B line, further declines in the pair should be anticipated.

COT Report

This image is no longer relevant

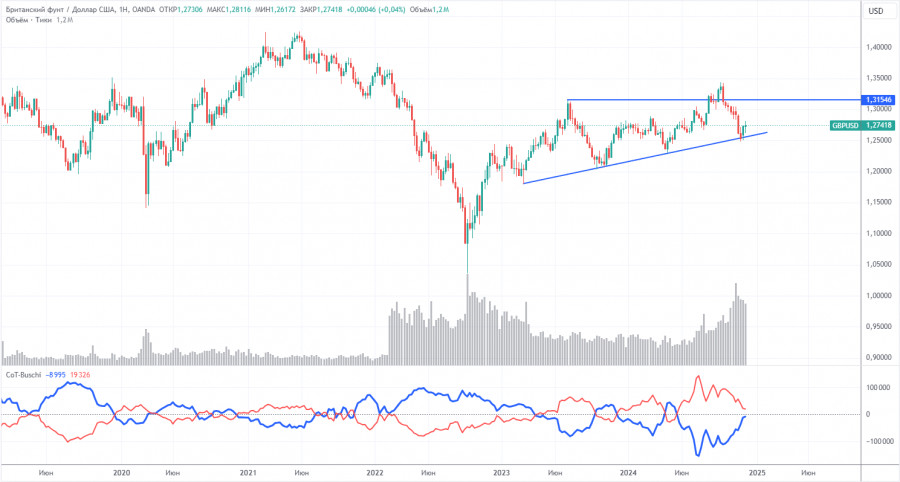
COT reports for the British pound reveal that the sentiment among commercial traders has fluctuated significantly over the past years. The red and blue lines representing net positions of commercial and non-commercial traders frequently cross and typically remain near the zero mark. The price has broken through the 1.3154 level and subsequently approached the trendline. We believe the trend has shifted to bearish, and further consolidation below the trendline is anticipated.

The latest COT report shows that the "non-commercial" group closed 400 BUY contracts and opened 1,900 SELL contracts. As a result, the net position of non-commercial traders decreased by 2,300 contracts over the week.

The fundamental backdrop does not justify long-term purchases of the pound sterling. The currency has a genuine chance to resume its broader downtrend. While the trendline has thus far prevented further declines, failure to breach it could lead to a new upward wave, potentially pushing the pound above 1.3500. However, what fundamental basis exists for such growth at the moment?

GBP/USD 1-Hour Analysis

This image is no longer relevant

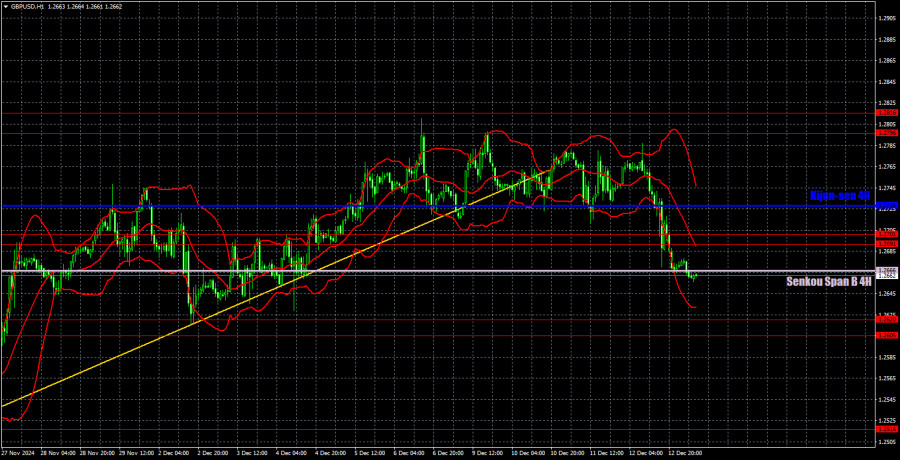
The GBP/USD pair maintains a bearish bias on the hourly timeframe, and the correction may already be complete. We still do not see any fundamental reasons for the rise of the pound sterling, except for the technical need to correct occasionally. The price has already corrected in this case, so further declines are expected in the coming weeks. While the upcoming Bank of England and Federal Reserve meetings could negatively impact the dollar, the likelihood of this is low.

The following key levels are highlighted for trading: 1.2429–1.2445, 1.2516, 1.2605–1.2620, 1.2691–1.2701, 1.2796–1.2816, 1.2863, 1.2981–1.2987, 1.3050. The Senkou Span B (1.2666) and Kijun-sen (1.2728) could also serve as signal sources. Setting a Stop Loss at breakeven after the price moves 20 pips in the intended direction is recommended. The Ichimoku lines may shift throughout the day, so this should be considered when identifying trading signals.

The UK is set to release reports on industrial production and GDP for October. However, as the GDP data is monthly, it is unlikely to have a significant market impact. Similarly, the industrial production report is not particularly important and is not expected to support the British currency.

Illustration Explanations:

  • Support and Resistance Levels (thick red lines): Key areas where price movement might stall. Not sources of trading signals.
  • Kijun-sen and Senkou Span B Lines: Ichimoku indicator lines transferred from the H4 timeframe to the hourly chart, serving as strong levels.
  • Extreme Levels (thin red lines): Points where the price has previously rebounded. They can serve as trading signal sources.
  • Yellow Lines: Trendlines, channels, or other technical patterns.
  • Indicator 1 on COT Charts: Reflects the net position size of each trader category.
Paolo Greco,
Analytical expert of InstaForex
© 2007-2025
Select timeframe
5
min
15
min
30
min
1
hour
4
hours
1
day
1
week
Earn on cryptocurrency rate changes with InstaForex
Download MetaTrader 4 and open your first trade
  • Grand Choice
    Contest by
    InstaForex
    InstaForex always strives to help you
    fulfill your biggest dreams.
    JOIN CONTEST

Recommended Stories

How to Trade the GBP/USD Pair on January 17? Simple Tips and Trade Analysis for Beginners

Analysis of Thursday's Trades 1H Chart of GBP/USD On Thursday, the GBP/USD pair exhibited low volatility and mostly moved sideways. This week has brought an unusual amount of notable reports

Paolo Greco 06:35 2025-01-17 UTC+2

How to Trade the EUR/USD Pair on January 17? Simple Tips and Trade Analysis for Beginners

Analysis of Thursday's Trades 1H Chart of EUR/USD On Thursday, the EUR/USD pair experienced low volatility and primarily moved sideways. As we had anticipated, the macroeconomic reports scheduled

Paolo Greco 06:35 2025-01-17 UTC+2

GBP/USD: Trading Plan for the U.S. Session on January 16 (Morning Review). The Pound Remains Under Pressure

In my morning forecast, I focused on the 1.2194 level and planned to make trading decisions based on its behavior. Let's analyze the 5-minute chart to see what happened

Miroslaw Bawulski 13:09 2025-01-16 UTC+2

EUR/USD: Trading Plan for the U.S. Session on January 16th (Morning Review)

In my morning forecast, I focused on the 1.0299 level and planned to make trading decisions based on its behavior. Let's analyze the 5-minute chart to see what happened

Miroslaw Bawulski 12:59 2025-01-16 UTC+2

How to Trade the GBP/USD Pair on January 16? Simple Tips and Trade Analysis for Beginners

Analysis of Wednesday's Trades 1H Chart of GBP/USD The GBP/USD pair struggled to maintain its upward correction on Wednesday, similar to the EUR/USD pair, as its attempt ended poorly

Paolo Greco 06:46 2025-01-16 UTC+2

How to Trade the EUR/USD Pair on January 16? Simple Tips and Trade Analysis for Beginners

Analysis of Wednesday's Trades 1H Chart of EUR/USD The EUR/USD pair exhibited significant volatility on Wednesday. Initially, the price remained stagnant as traders awaited the release of the US inflation

Paolo Greco 06:45 2025-01-16 UTC+2

Trading Recommendations and Analysis for GBP/USD on January 16: The Pound Falls as Quickly as It Rises

The GBP/USD currency pair experienced gains for most of Wednesday, which is somewhat unusual. Earlier in the day, the UK released its inflation report, indicating a decline in December. This

Paolo Greco 03:19 2025-01-16 UTC+2

Trading Recommendations and Analysis for EUR/USD on January 16: Another Logical Collapse

On Wednesday, the EUR/USD currency pair initially traded upward for most of the day but later lost all its gains as the euro declined significantly. In our fundamental analysis

Paolo Greco 03:19 2025-01-16 UTC+2

GBP/USD: Trading Plan for the U.S. Session on January 15th (Morning Trade Analysis)

In my morning forecast, I highlighted the 1.2194 level as a key decision point for market entry. Let's review the 5-minute chart and analyze what occurred. A decline followed

Miroslaw Bawulski 13:05 2025-01-15 UTC+2

EUR/USD: Trading Plan for the U.S. Session on January 15th (Morning Trade Analysis)

In my morning forecast, I highlighted the level of 1.0324 as a critical decision point for market entry. Let's look at the 5-minute chart to analyze what happened. The rise

Miroslaw Bawulski 12:57 2025-01-15 UTC+2
Can't speak right now?
Ask your question in the chat.
Widget callback
 

Dear visitor,

Your IP address shows that you are currently located in the USA. If you are a resident of the United States, you are prohibited from using the services of InstaFintech Group including online trading, online transfers, deposit/withdrawal of funds, etc.

If you think you are seeing this message by mistake and your location is not the US, kindly proceed to the website. Otherwise, you must leave the website in order to comply with government restrictions.

Why does your IP address show your location as the USA?

  • - you are using a VPN provided by a hosting company based in the United States;
  • - your IP does not have proper WHOIS records;
  • - an error occurred in the WHOIS geolocation database.

Please confirm whether you are a US resident or not by clicking the relevant button below. If you choose the wrong option, being a US resident, you will not be able to open an account with InstaForex anyway.

We are sorry for any inconvenience caused by this message.