empty
 
 
24.10.2024 12:59 PM
GBP/USD. October 24th. The Pound Starts Falling Before It Could Rise

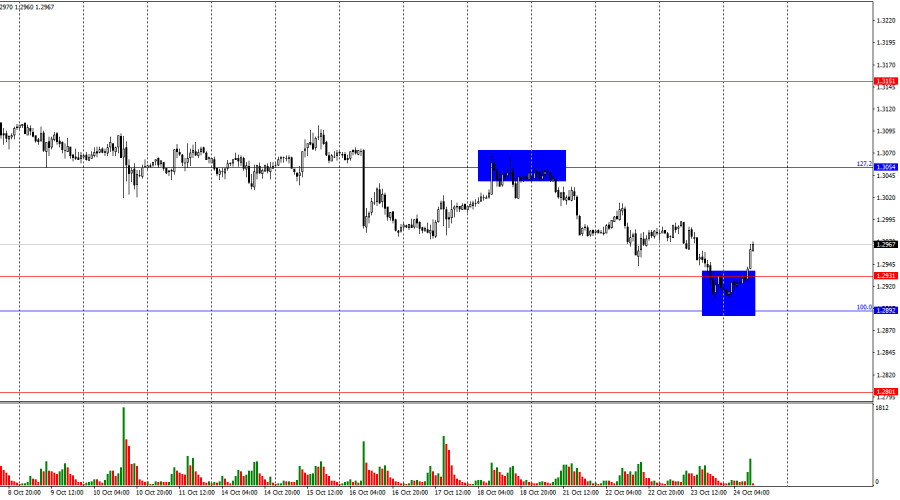
On the hourly chart, the GBP/USD pair on Wednesday traded within the 1.2892–1.2931 zone. This suggests that the pound may have a short-term opportunity for recovery after nearly a month of decline. However, the bulls have not yet managed to surpass even the last price peak from the previous day. They require momentum to do so, but today's session may provide very little of it. No matter the outcome of today's session, I believe that buying in such a strong downtrend remains risky.

This image is no longer relevant

The wave pattern is clear. The last completed upward wave (on September 26) failed to surpass the peak of the previous wave. Meanwhile, the downward wave, forming over the past 20 days, easily broke through the previous wave's low at the 1.3311 level. Thus, the "bullish" trend is now considered over, and the formation of a "bearish" trend has begun. From the 1.2931 level, an upward corrective wave could be expected, but graphical signals need to form.

As mentioned earlier, the pound could potentially rise by at least 100 points; however, the first reports this week from the UK suggest that the pound is more likely to continue falling. The Manufacturing PMI in October came in at only 50.3 points, which is below traders' expectations. The Services PMI for October stood at 51.8 points, which is also below forecasts. If the US PMI data this afternoon is higher than expected, bears may resume their attacks. In that case, a rebound from the 1.2892–1.2931 zone would mean very little. Thus, while the pound may be inclined to show some growth, there are practically no reasons for it to do so. One could say that a "correction is brewing," but it has been brewing for a couple of weeks already. All indicators consistently show oversold conditions and display "bullish" divergences. Yet, the pound continues to fall, fall, and fall.

This image is no longer relevant

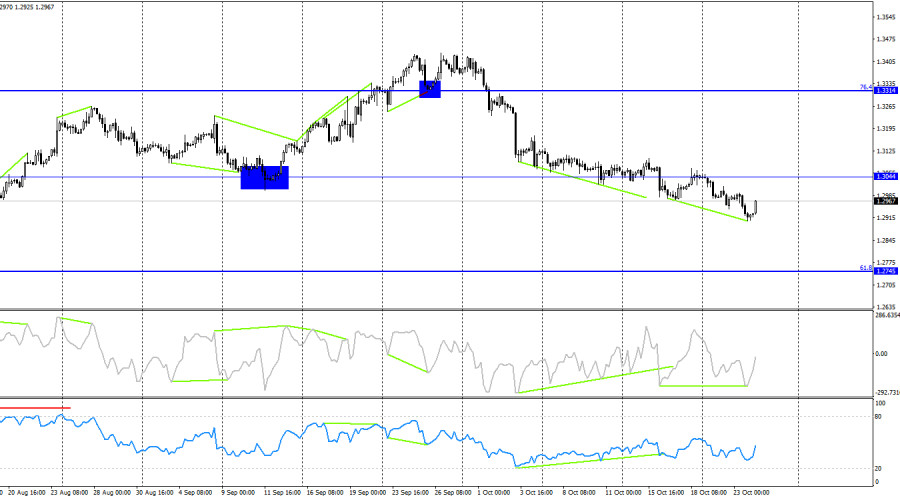
On the 4-hour chart, the pair has consolidated below the 1.3044 corrective level, which suggests further declines toward the next 61.8% corrective level at 1.2745. A new "bullish" divergence has formed on the CCI indicator, which allows the pound to potentially rise at least to the 1.3044 level. A rebound from this level would favor the US dollar and a resumption of the decline toward the 61.8% corrective level at 1.2745.

Commitments of Traders (COT) Report:

This image is no longer relevant

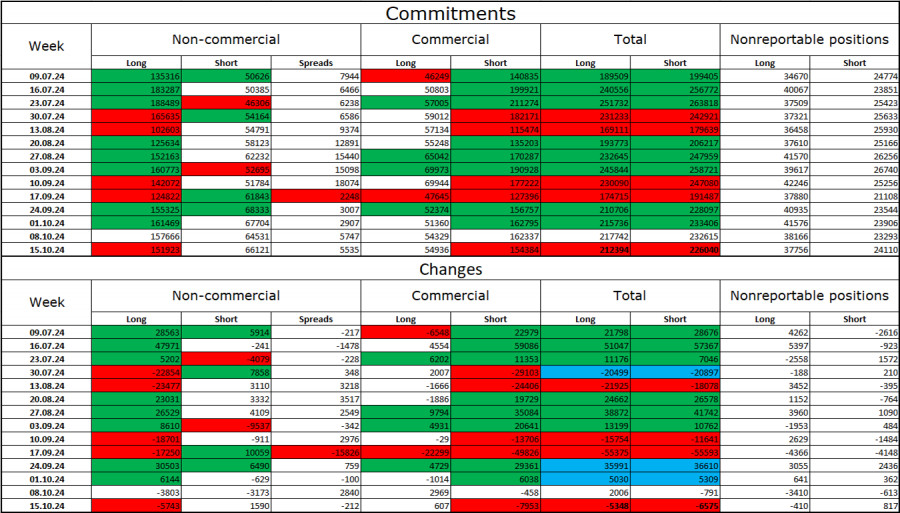
The sentiment among "Non-commercial" traders remained unchanged and is still "strongly bullish." The number of long positions held by speculators decreased by 5,743, while the number of short positions increased by 1,590. The bulls still have a strong advantage. The gap between the number of long and short contracts is 86,000: 152,000 versus 66,000.

In my opinion, the pound still has the potential to decline, but the COT reports currently suggest otherwise. Over the past three months, the number of long positions has increased from 135,000 to 152,000, while the number of short positions has risen from 50,000 to 66,000. I believe that over time, professional players will start reducing their long positions or increasing their short positions, as all potential factors for buying the British pound have already been exhausted. Graphical analysis suggests that this process could begin soon (or may have already started, judging by the waves).

News Calendar for the US and the UK:

  • UK – Manufacturing PMI (08:30 UTC)
  • UK – Services PMI (08:30 UTC)
  • US – Change in Initial Jobless Claims (12:30 UTC)
  • US – Manufacturing PMI (13:45 UTC)
  • US – Services PMI (13:45 UTC)

On Thursday, the economic calendar includes several entries that are unlikely to significantly support the bulls. The impact of the information background on market sentiment today is expected to be minimal.

Forecast for GBP/USD and Trader Tips:

Sales of the pair were possible following a rebound from the 1.3425 level on the hourly chart, with targets at 1.3357, 1.3259, 1.3151, and 1.3054. All targets were reached. New positions could be opened after a close below 1.3044 on the 4-hour chart with a target of 1.2931, and this target was also met. I see no potential signals for purchases.

Fibonacci levels are drawn from 1.2892–1.2298 on the hourly chart and from 1.4248–1.0404 on the 4-hour chart.

Samir Klishi,
Analytical expert of InstaForex
© 2007-2024
Earn on cryptocurrency rate changes with InstaForex
Download MetaTrader 4 and open your first trade
  • Grand Choice
    Contest by
    InstaForex
    InstaForex always strives to help you
    fulfill your biggest dreams.
    JOIN CONTEST
  • Chancy Deposit
    Deposit your account with $3,000 and get $1000 more!
    In October we raffle $1000 within the Chancy Deposit campaign!
    Get a chance to win by depositing $3,000 to a trading account. Having fulfilled this condition, you become a campaign participant.
    JOIN CONTEST
  • Trade Wise, Win Device
    Top up your account with at least $500, sign up for the contest, and get a chance to win mobile devices.
    JOIN CONTEST
  • 100% Bonus
    Your unique opportunity to get a 100% bonus on your deposit
    GET BONUS
  • 55% Bonus
    Apply for a 55% bonus on your every deposit
    GET BONUS
  • 30% Bonus
    Receive a 30% bonus every time you top up your account
    GET BONUS

Recommended Stories

Can't speak right now?
Ask your question in the chat.
Widget callback