Analysis of Tuesday's Trades:
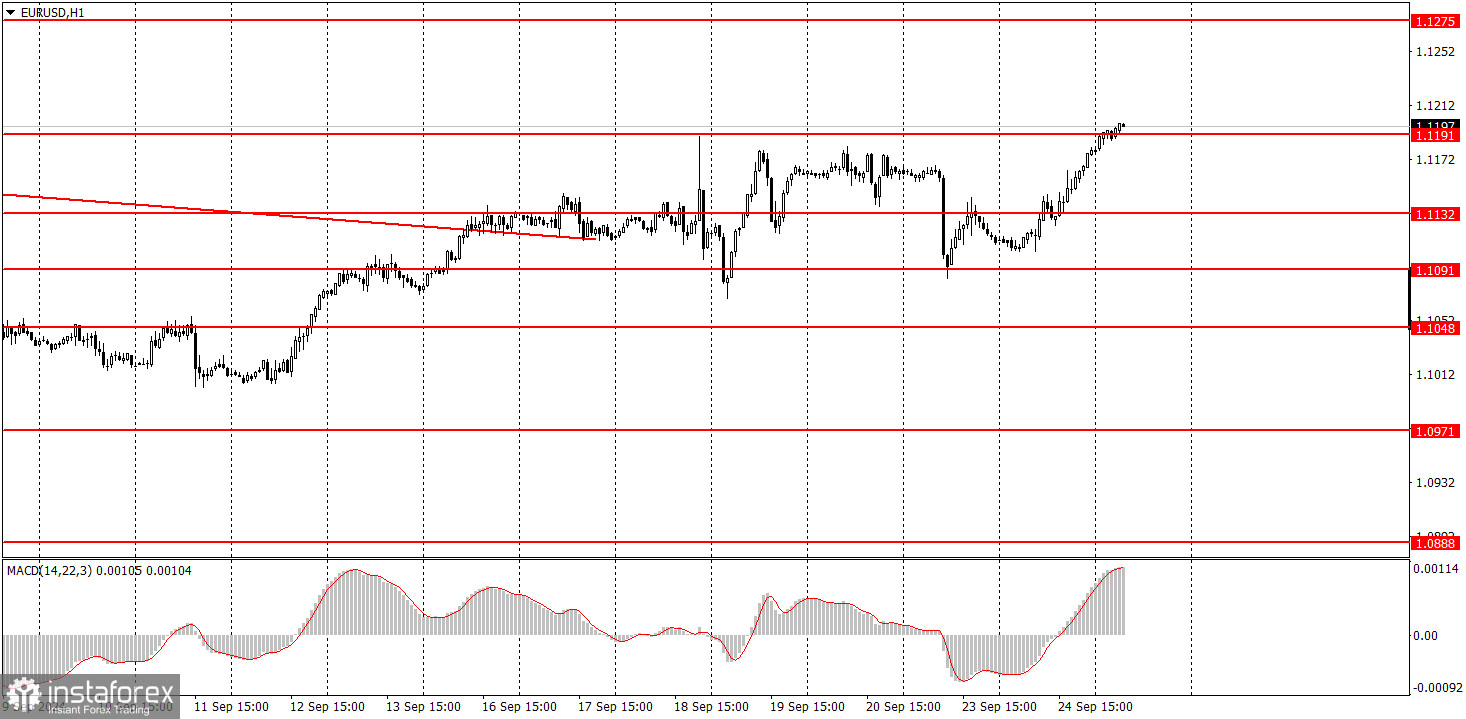
EUR/USD on 1H Chart
The EUR/USD pair gradually resumed its upward movement on Tuesday. Let's recall that yesterday, we mentioned the horizontal channel where the price had traded over the past week. However, as we can see, the market's desire to buy hasn't disappeared. Yesterday, there were no significant macroeconomic events in the U.S. or the Eurozone. To say that the euro rose by 65 pips due to the German Business Climate Index (which also came in below expectations) would be absurd. Therefore, the euro again appreciated for no particular reason amid a complete lack of driving factors. We have been regularly highlighting this since the beginning of 2024. The market continues to consider all the bearish factors for the dollar and the dovish ones from the Federal Reserve while ignoring everything else. The upward movement is entirely illogical.
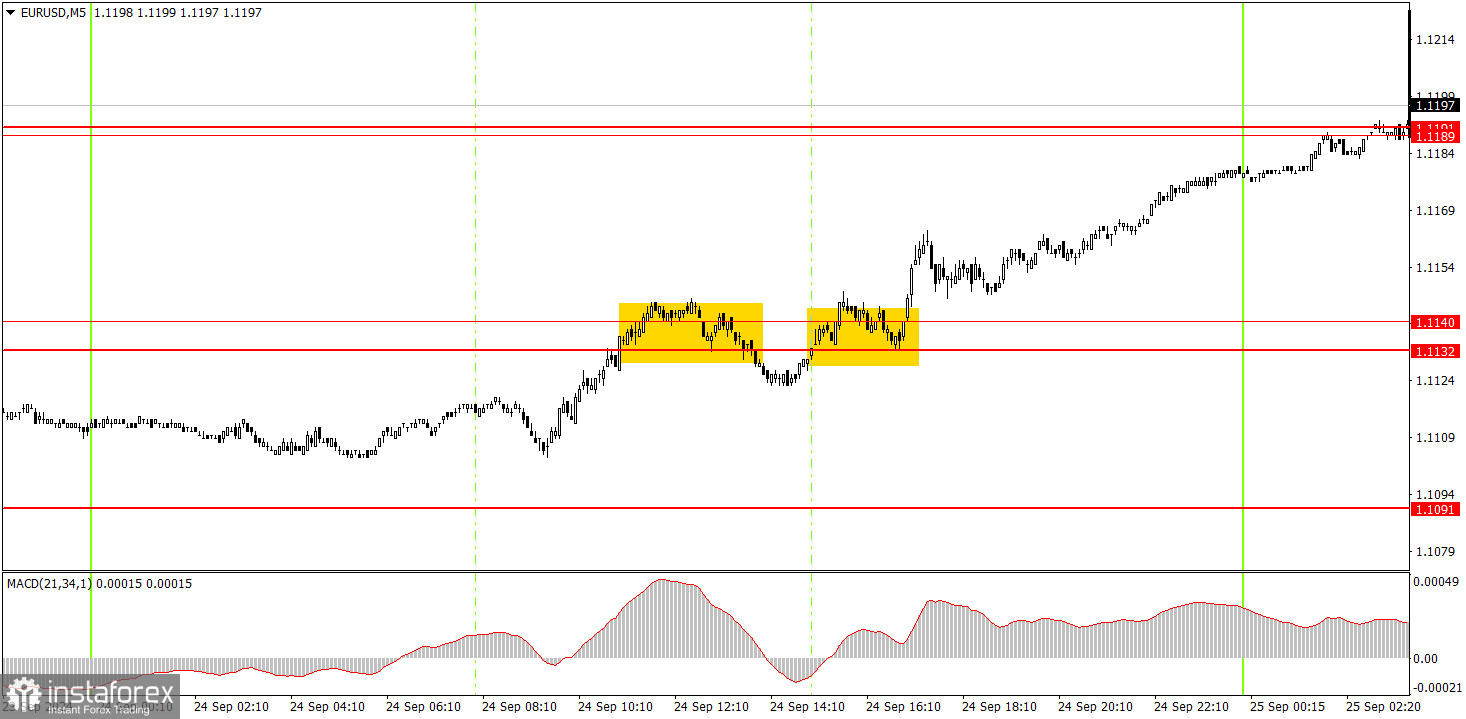
EUR/USD on 5M Chart
Two trading signals were formed in the 5-minute time frame on Tuesday. First, the pair attempted to reverse around the 1.1132-1.1140 area, and this reversal would have seemed quite logical and reasonable. However, the market's persistent desire to buy the euro led to the pair consolidating above this area within just a few hours. It then rose to the next area of 1.1189-1.1191. Thus, novice traders could have initially opened a short position and then a long one. The profit from the long position turned out to be greater than the loss from the short position.
How to Trade on Wednesday:
In the hourly time frame, the pair still has a chance to form a downward trend, but these chances are fading. Unfortunately, the illogical selling of the dollar can easily continue in the medium term, as no one knows how much longer the market will be pricing in the Fed's monetary easing while ignoring the European Central Bank's easing policies. The market continues to factor in all future Fed rate cuts into the dollar's rate, paying no attention to factors that could support the U.S. currency.
On Wednesday, we can expect nothing but a downward correction. The euro remains overbought and unjustifiably expensive, but it continues to appreciate. There was no reaction from the 1.1191 level, so the price may head toward the 1.1275 level by the end of the week.
In the 5-minute time frame, the levels to consider are 1.0726-1.0733, 1.0797-1.0804, 1.0838-1.0856, 1.0888-1.0896, 1.0940, 1.0971, 1.1011, 1.1048, 1.1091, 1.1132-1.1140, 1.1189-1.1191, and 1.1275-1.1292. On Wednesday, there are no significant events scheduled in the Eurozone or the United States. However, yesterday, the market once again demonstrated that it is ready to buy the euro and sell the dollar even without any macroeconomic backdrop.
Basic Rules of the Trading System:
1) The strength of a signal is determined by the time it takes for the signal to form (bounce or level breakthrough). The less time it took, the stronger the signal.
2) If two or more trades were opened around any level due to false signals, subsequent signals from that level should be ignored.
3) In a flat market, any currency pair can form multiple false signals or none at all. In any case, it's better to stop trading at the first signs of a flat market.
4) Trades should be opened between the start of the European session and midway through the U.S. session. After this period, all trades must be closed manually.
5) In the hourly time frame, trades based on MACD signals are only advisable amidst good volatility and a trend confirmed by a trendline or trend channel.
6) If two levels are too close to each other (5 to 20 pips), they should be considered a support or resistance area.
7) After moving 15 pips in the intended direction, the Stop Loss should be set to break even.
What's on the Charts:
Support and Resistance price levels: targets for opening long or short positions. You can place Take Profit levels around them.
Red lines: channels or trend lines that depict the current trend and indicate the preferred trading direction.
The MACD indicator (14,22,3): encompassing both the histogram and signal line, acts as an auxiliary tool and can also be used as a source of signals.
Important speeches and reports (always noted in the news calendar) can profoundly influence the movement of a currency pair. Hence, trading during their release calls for heightened caution. It may be reasonable to exit the market to avoid sharp price reversals against the prevailing movement.
For beginners, it's important to remember that not every trade will yield profit. Developing a clear strategy and effective money management is key to success in trading over the long term.