empty
19.09.2024 12:58 PM
Forecast of GBP/USD pair on September 19, 2024

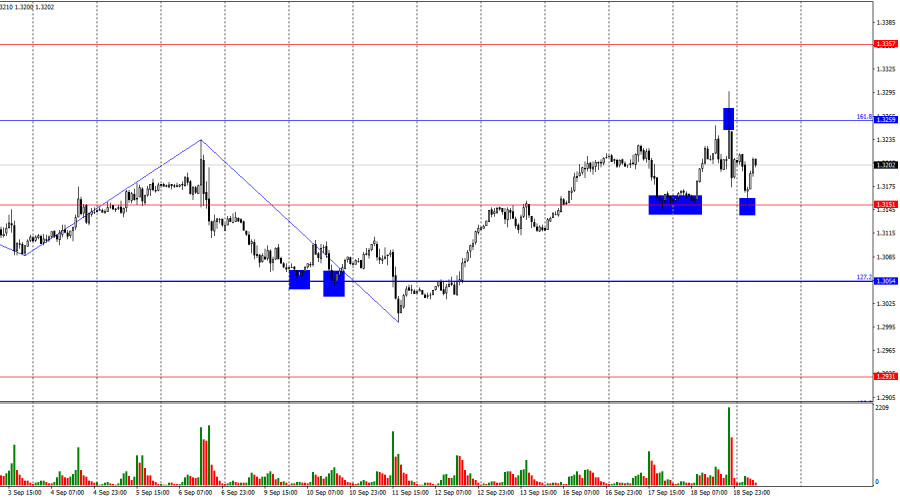
On the hourly chart, the GBP/USD pair rose to the 161.8% corrective level at 1.3259, then rebounded from it, fell to 1.3151 and rebounded from that level. Therefore, we can expect a rise back to the 1.3259 level today. Another rebound from this level will favor the U.S. dollar and lead to a decline towards 1.3151. Consolidation above 1.3259 will increase the likelihood of further appreciation of the pound. Closing below 1.3151 will maintain the "bearish" trend.

This image is no longer relevant

The current wave structure raises no concerns. The last completed downward wave broke below the previous wave's low, while the last upward wave broke the high of the previous wave, located at 1.3234. However, this breakout occurred during heightened market volatility after an important event, and I do not consider it confirmed. Therefore, we are still dealing with a "bearish" trend. I believe it is better to use the 1.3259 level to determine whether the "bearish" trend will break or persist.

The Fed did everything it could to ensure the dollar's decline, but the U.S. currency held its ground. Today it faces its second test. While the Fed was expected to cut rates regardless, the Bank of England is very unlikely to announce a monetary easing decision today. The U.K. inflation report released on Tuesday showed another increase, making it reasonable for the Bank of England to pause. Traders may interpret this decision as "hawkish," especially against the backdrop of the Fed's easing. Thus, the pound will have support today as well. I believe the U.S. currency still has a chance to rise in the near future, provided it remains below 1.3259. In my view, the future easing of the FOMC's monetary policy will not be as aggressive as the market expects. The trend has not turned "bullish," and the dollar is falling too sharply given the current market sentiment.
This image is no longer relevant

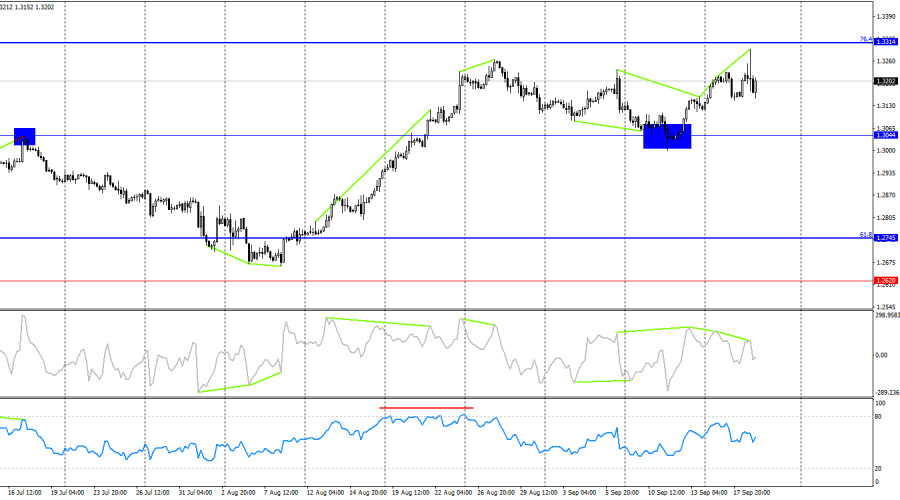
On the 4-hour chart, the pair rebounded from the 1.3044 level, reversed, benefiting the pound, and continued to rise towards the 76.4% Fibonacci level at 1.3314. The CCI indicator has already formed two "bearish" divergences, suggesting the potential for a decline. However, with the current strength of the bulls, a third "bearish" divergence could form. The pound remains overbought, as indicated by the RSI since August. Since then, the pound has barely fallen.

Commitments of Traders (COT) Report

This image is no longer relevant

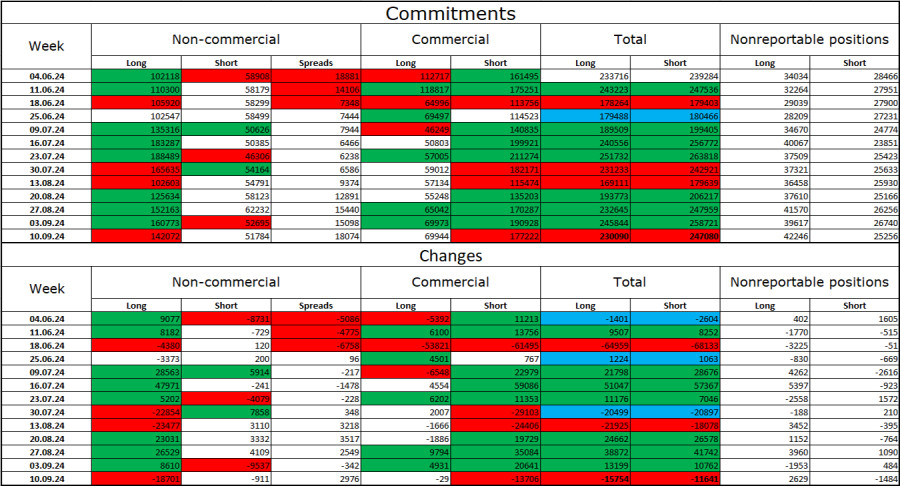
Non-commercial traders became significantly less bullish over the past week. The number of long positions held by speculators decreased by 18,701, while the number of short positions fell by only 911. Bulls still hold a solid advantage. The gap between long and short positions stands at 90,000: 142,000 against 52,000.

In my view, the pound still faces prospects for a decline, but the COT reports currently suggest otherwise. Over the past three months, the number of long positions has increased from 102,000 to 142,000, while the number of short positions has decreased from 58,000 to 52,000. I believe that over time, professional players will start to offload long positions or increase short positions, as most factors supporting the pound's rise have already been priced in. However, it's important to remember that this is just an assumption. Chart analysis indicates a "bearish" trend at the moment, but it remains unstable.

Economic Calendar for the U.S. and U.K.

  • U.K. – Bank of England Interest Rate Decision (11:00 UTC)
  • U.K. – MPC Voting Results (11:00 UTC)
  • U.K. – Bank of England's Accompanying Statement (11:00 UTC)
  • U.S. – Initial Jobless Claims (12:30 UTC)
  • U.S. – Philadelphia Fed Business Activity Index (12:30 UTC)
  • U.S. – New Home Sales (12:30 UTC)

On Thursday, the economic calendar contains three significant events and three less important ones. The impact of the news background on market sentiment will be strong for the rest of the day.

GBP/USD Forecast and Trading Recommendations

Sales of the pair are possible today if the hourly chart closes below the 1.3151 level, targeting 1.3054. Or after a rebound from the 1.3259 level, targeting 1.3151. I wouldn't rush into buying, but short-term trades can be considered with a target of 1.3259 if there is a rebound from the 1.3151 level.

Fibonacci levels are drawn from 1.2892 to 1.2298 on the hourly chart and from 1.4248 to 1.0404 on the 4-hour chart.

Samir Klishi,
Analytical expert of InstaForex
© 2007-2025
Select timeframe
5
min
15
min
30
min
1
hour
4
hours
1
day
1
week
Earn on cryptocurrency rate changes with InstaForex
Download MetaTrader 4 and open your first trade
  • Chancy Deposit
    Deposit your account with $3,000 and get $10000 more!
    In January we raffle $10000 within the Chancy Deposit campaign!
    Get a chance to win by depositing $3,000 to a trading account. Having fulfilled this condition, you become a campaign participant.
    JOIN CONTEST

Recommended Stories

EUR/USD: January 22nd. Bulls Persist in Trying to Take Control

On Tuesday, the EUR/USD pair declined to the support zone of 1.0336–1.0346, rebounded from it, reversed in favor of the euro, and rose to the resistance zone of 1.0435–1.0448

Samir Klishi 11:25 2025-01-22 UTC+2

Forecast for GBP/USD on January 22, 2025

On the hourly chart, the GBP/USD pair reversed in favor of the pound on Tuesday and rose nearly to the resistance zone of 1.2363–1.2370. However, the pair fell short

Samir Klishi 11:21 2025-01-22 UTC+2

Video analysis for January 22, 2025

Potential for the further rally on EUR/USD

Petar Jacimovic 10:16 2025-01-22 UTC+2

Technical Analysis of Intraday Price Movement of AUD/JPY Cross Currency Pairs, Wednesday January 22, 2025.

If we look at the 4-hour chart of the AUD/JPY cross currency pair, it appears that Buyers are starting to enter again, which is confirmed by the appearance of divergence

Arief Makmur 09:28 2025-01-22 UTC+2

Technical Analysis of Intraday Price Movement of EUR/USD Main Currency Pairs, Wednesday January 22, 2025.

If we look at the 4-hour chart of the main currency pair EUR/USD, it appears that there is a divergence between the Fiber price movement and the MACD Histogram indicator

Arief Makmur 09:28 2025-01-22 UTC+2

EUR/USD and GBP/USD on January 22 - Technical Analysis of the Situation

Yesterday's trading failed to maintain the upward momentum, but the pair remained above the weekly short-term trend level of 1.0404. If the bulls can hold their position and overcome

Evangelos Poulakis 07:45 2025-01-22 UTC+2

Forecast for EUR/USD on January 22, 2025

Yesterday's session displayed strong intraday volatility across the financial markets. As noted previously, the first day of Donald Trump's presidency appears to be more ambiguous for the financial world

Laurie Bailey 03:42 2025-01-22 UTC+2

Forecast for GBP/USD on January 22, 2025

The British pound has approached the resistance level of 1.2367, which aligns with the Fibonacci retracement of the most recent decline from December 6 to January 13. This retracement

Laurie Bailey 03:42 2025-01-22 UTC+2

Forecast for USD/JPY on January 22, 2025

On Tuesday, the USD/JPY pair traded within a range of 144 pips, ultimately closing with a slight decline of 12 pips. This movement suggests a continuation of a sideways trend

Laurie Bailey 03:42 2025-01-22 UTC+2

Trading Signals for EUR/USD for January 21-25, 2025: buy above 1.0327 (21 SMA - 200 EMA)

In case the Euro falls below the 21 SMA located at 1.0327, the bearish outlook could resume and we could expect a new bearish cycle. So, the Euro could reach

Dimitrios Zappas 16:59 2025-01-21 UTC+2
Can't speak right now?
Ask your question in the chat.
Widget callback
 

Dear visitor,

Your IP address shows that you are currently located in the USA. If you are a resident of the United States, you are prohibited from using the services of InstaFintech Group including online trading, online transfers, deposit/withdrawal of funds, etc.

If you think you are seeing this message by mistake and your location is not the US, kindly proceed to the website. Otherwise, you must leave the website in order to comply with government restrictions.

Why does your IP address show your location as the USA?

  • - you are using a VPN provided by a hosting company based in the United States;
  • - your IP does not have proper WHOIS records;
  • - an error occurred in the WHOIS geolocation database.

Please confirm whether you are a US resident or not by clicking the relevant button below. If you choose the wrong option, being a US resident, you will not be able to open an account with InstaForex anyway.

We are sorry for any inconvenience caused by this message.