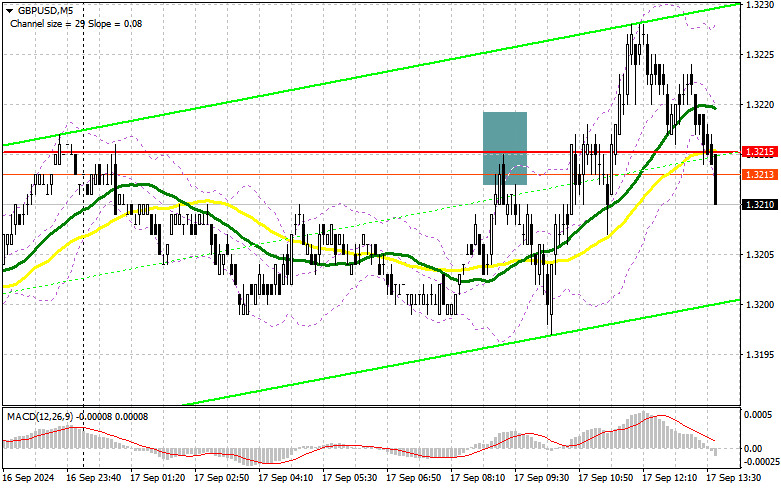
In my morning forecast, I highlighted the 1.3215 level and planned to make trading decisions based on it. Let's look at the 5-minute chart and see what happened. The rise and false breakout at 1.3215 triggered a sell signal for the pound, resulting in a correction of only 20 points, after which demand returned. The technical outlook has been revised for the second half of the day.
To open long positions on GBP/USD:
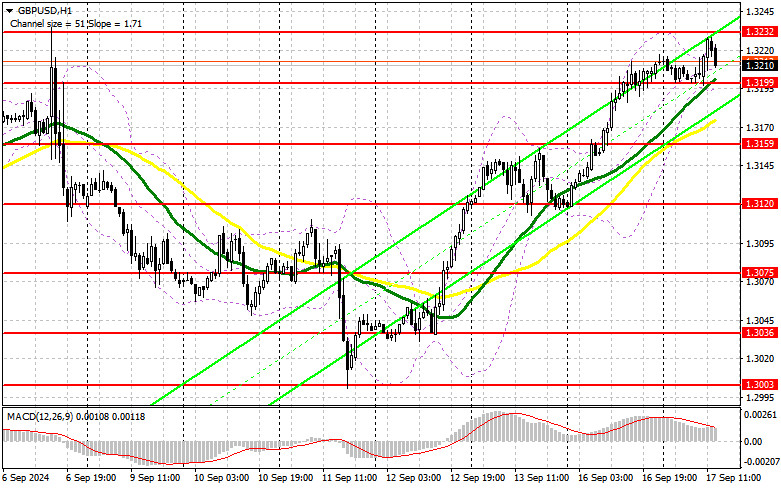
The absence of U.K. statistics had its effect, allowing the pound to once again update its weekly high. In the second half of the day, we expect data on retail sales, industrial production, capacity utilization, and the NAHB housing market index. In case of a negative reaction to the data, I will prefer to return to long positions only after a decline and the formation of a false breakout around the new support level of 1.3199, where the moving averages are slightly below. This will create an opportunity for the pair's recovery toward 1.3232, which it almost tested earlier. A breakout and retest of this range from above will strengthen the chances of developing an upward trend, triggering sellers' stop orders and providing a suitable entry point for long positions, aiming for a move toward 1.3263. The furthest target will be the 1.3300 level, where I plan to take profits. If GBP/USD declines and there is no activity from the bulls at 1.3199 in the second half of the day, pressure on the pair will increase. This could lead to a drop and an update of the next support at 1.3159, which would ruin buyers' plans for growth ahead of tomorrow's Fed meeting. Only a false breakout at this level would create a suitable condition for opening long positions. I plan to buy GBP/USD immediately on a rebound from the 1.3120 low, aiming for an intraday correction of 30-35 points.
To open short positions on GBP/USD:
Sellers resisted buyers' attempts, even though they allowed a weekly high update, indicating that the upward trend is still in place. Only very strong U.S. data could break the trend. I prefer to act against the trend after a rise and a false breakout at the new resistance level of 1.3232. The target will be the morning support at 1.3199. A breakout and retest from below this range will hit buyers' positions, triggering stop orders and opening the path toward 1.3159. The furthest target will be the 1.3120 level, where I will take profits. If GBP/USD rises and there is no activity at 1.3232 in the second half of the day, buyers will continue pushing the pound higher, even despite tomorrow's Federal Reserve meeting. Therefore, bears will have no choice but to retreat to the 1.3263 resistance area. I will sell there only on a false breakout. If there is no downward movement there either, I will look for short positions on a rebound from 1.3300, aiming for a downward correction of 30-35 points intraday.

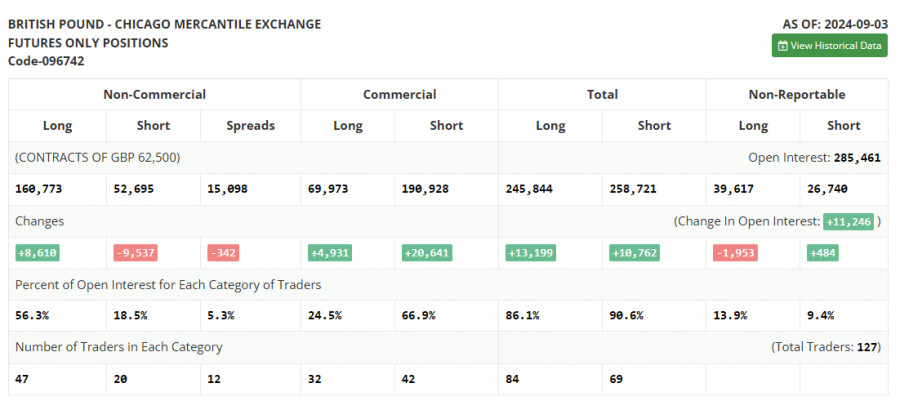
The COT (Commitment of Traders) report from September 3 showed an increase in long positions and a decrease in short positions. It is evident that, despite the pair's correction, traders are confident that U.S. rate cuts are a much more important event than similar actions by the Bank of England. The market is likely pricing in the future interest rate reductions in the U.K., and demand for the pound will likely return soon, as the medium-term upward trend remains intact. The lower the pair goes, the more attractive it becomes for new purchases. The ratio of long to short positions, with shorts being three times fewer, speaks for itself. The latest COT report indicated that long non-commercial positions rose by 8,610 to 160,773, while short non-commercial positions decreased by 9,537 to 52,695. As a result, the gap between long and short positions narrowed by 342.
Indicator signals:
Moving averages:
Trading is taking place above the 30- and 50-day moving averages, indicating further growth in the pair.
Note: The period and prices of the moving averages are considered by the author on the hourly H1 chart and differ from the general definition of classic daily moving averages on the D1 daily chart.
Bollinger Bands:
In the event of a decline, the lower boundary of the indicator around 1.3199 will serve as support.
Indicator descriptions:
- Moving average (MA): Determines the current trend by smoothing volatility and noise. Period 50. Marked in yellow on the chart.
- Moving average (MA): Determines the current trend by smoothing volatility and noise. Period 30. Marked in green on the chart.
- MACD indicator (Moving Average Convergence/Divergence): Fast EMA period 12. Slow EMA period 26. SMA period 9.
- Bollinger Bands: Period 20.
- Non-commercial traders: Speculators such as individual traders, hedge funds, and large institutions using the futures market for speculative purposes and meeting specific requirements.
- Long non-commercial positions: Represent the total long open position of non-commercial traders.
- Short non-commercial positions: Represent the total short open position of non-commercial traders.
- Total non-commercial net position: The difference between short and long positions of non-commercial traders.


