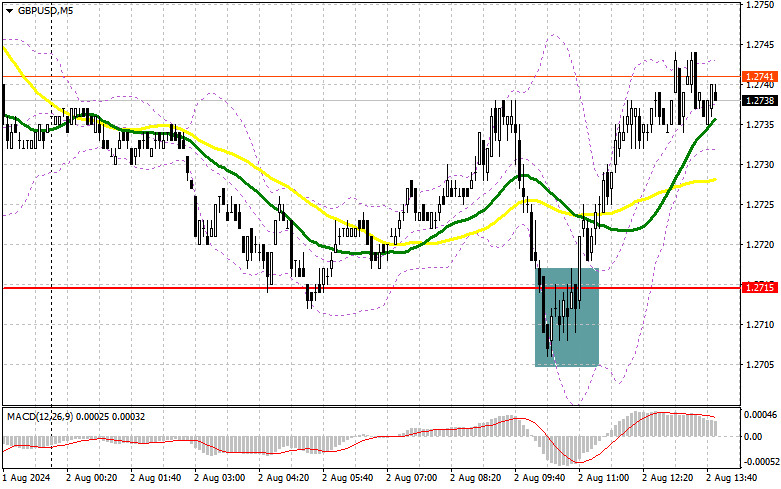
In my morning forecast, I focused on the 1.2715 level and planned to base my market entry decisions on it. Let's look at the 5-minute chart and see what happened there. A decrease and formation of a false breakout at 1.2715 allowed for market entry, resulting in a rise of more than 30 points. The technical picture for the second half of the day was slightly revised.
To open long positions on GBP/USD:
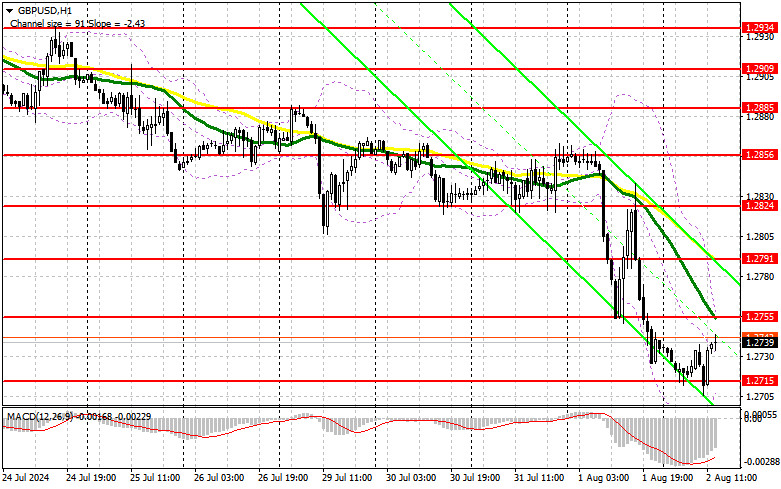
Active defense by buyers at the new weekly low leaves the pound a chance to rise after the release of today's abundant American statistics. Data on the unemployment rate, changes in non-farm employment, and changes in average hourly earnings will be crucial. In the case of strong statistics, we will see another drop in the pound to around 1.2715, where I once again expect active buyer actions. A false breakout formation there, similar to what I analyzed above, will provide an entry point with a target of returning to 1.2755, the new resistance where moving averages are located. A breakout and reverse test from above to below this range will return chances for the pound to rise, leading to an entry point for long positions with a potential exit at the level of 1.2791. The furthest target will be the area of 1.2824, where I plan to take profits. In the scenario of further decline of GBP/USD and lack of activity by bulls at 1.2715 in the second half of the day, which this level has already worked off once today, all this will lead to a decrease and renewal of the next support at 1.2679, increasing the chances of a larger drop in the pair. Therefore, only the formation of a false breakout will justify opening long positions. I plan to buy GBP/USD immediately on a rebound from the 1.2640 minimum, targeting a correction of 30-35 points within the day.
To open short positions on GBP/USD:
Sellers are in control of the market, although the chances for a larger correction after the U.S. labor market data are very high. In the event of a bullish reaction, I plan to sell only after a false breakout around the new resistance at 1.2755, which will provide an opportunity to open new short positions. The target will be to renew the weekly minimum and support at 1.2715, which has already been tested once today. A breakout and reverse test from below to above this range will strike buyer positions, leading to the clearing of stop orders and paving the way to 1.2679. The furthest target will be the area of 1.2640, where I will take profits. Testing this level will only strengthen the new bearish trend. In the event of an upward movement of GBP/USD and lack of activity at 1.2755 in the second half of the day, buyers will get a good chance for a larger upward surge – especially in the case of a higher-than-expected increase in the number of jobs. In that case, I will postpone sales until a false breakout at the level of 1.2791. If there is no downward movement, I will sell GBP/USD immediately on a rebound from 1.2824, but only with the expectation of a correction of the pair down by 30-35 points within the day.

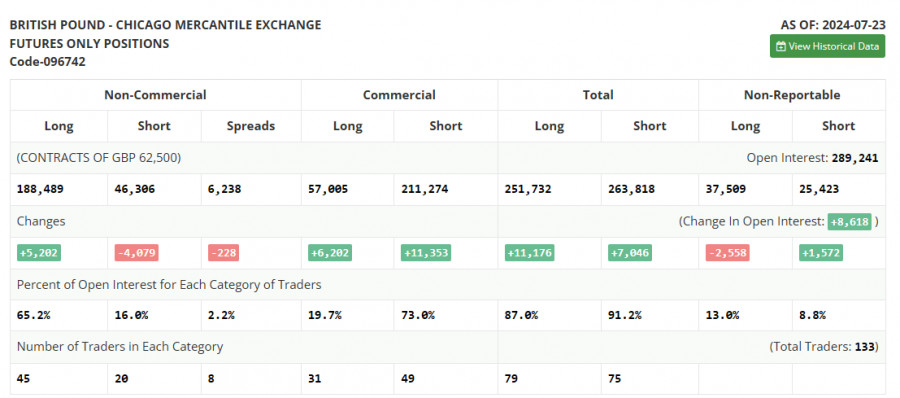
In the COT report (Commitment of Traders) for July 23, there was an increase in long positions and a reduction in short positions. The focus is on the Federal Reserve meeting, where rates are unlikely to change, but investors hope to hear more arguments for a rate reduction in September. Meanwhile, the Bank of England's decision, which will also be published very soon, may cause a lot of noise. Economists expect the Bank of England to lower rates this summer, which theoretically should weaken the British pound against the U.S. dollar even more. Therefore, expecting a return to the bullish market observed in June anytime soon is clearly no longer feasible. The latest COT report states that long non-commercial positions grew by 5,202 to a level of 188,489, while short non-commercial positions fell by 4,079 to a level of 46,306. As a result, the spread between long and short positions dropped by 228.
Indicator Signals:
Moving Averages:
Trading is conducted below the 30 and 50-day moving averages, indicating a possible continuation of the pair's decline.
Note: The period and prices of the moving averages are considered by the author on the hourly H1 chart and differ from the general definition of classic daily moving averages on the daily D1 chart.
Bollinger Bands:
In the event of a decline, the lower boundary of the indicator, around 1.2715, will act as support.
Description of Indicators:
- Moving average (determines the current trend by smoothing volatility and noise). Period 50. Marked in yellow on the chart.
- Moving average (determines the current trend by smoothing volatility and noise). Period 30. Marked in green on the chart.
- MACD indicator (Moving Average Convergence/Divergence — convergence/divergence of moving averages). Fast EMA period 12. Slow EMA period 26. SMA period 9.
- Bollinger Bands. Period 20.
- Non-commercial traders — speculators such as individual traders, hedge funds, and large institutions that use the futures market for speculative purposes and meet certain requirements.
- Long non-commercial positions represent the total long open position of non-commercial traders.
- Short non-commercial positions represent the total short open positions of non-commercial traders.
- The total non-commercial net position i


