Analysis of GBP/USD 5M
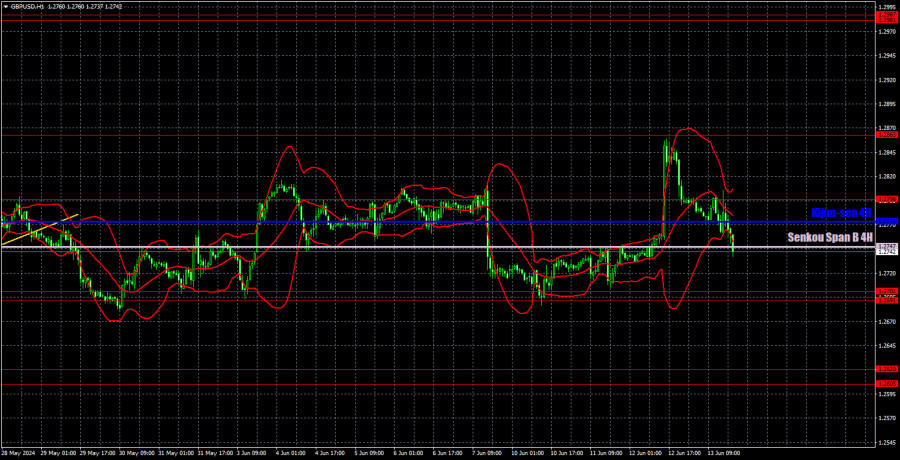
GBP/USD lost 40 pips on Thursday, which is too small for us to draw any significant conclusions. Although the pair showed substantial growth on Wednesday and broke out of the sideways channel of 1.2691-1.2796, the sideways movement remains intact. The pair exhibited a strong rise, triggered by important data that the market responded to with much enthusiasm, but the nature of the movement hasn't changed. For over three weeks now, the pound has been trading in another sideways channel at local highs. Unless the price overcomes the area of 1.2691-1.2701, it wouldn't make sense to expect the British currency to fall. It is hard to say how much longer this will take, as the market sees no reason to sell the pound and buy the dollar.
The UK economic calendar was generally empty on Thursday, and the U.S. macro data could have easily led to a new fall in the dollar. The U.S. Producer Price Index turned out to be lower than expected, which could be interpreted as U.S. inflation slowing down again. This is enough reason to sell the US currency for the market. It doesn't matter that inflation is slowing down at a pace that would require another year to reach the Federal Reserve's target level. And that's only if the slowdown happens every month, which we highly doubt. But somehow, the dollar managed to avoid another fall yesterday. However, the situation hasn't significantly changed and certainly hasn't improved.
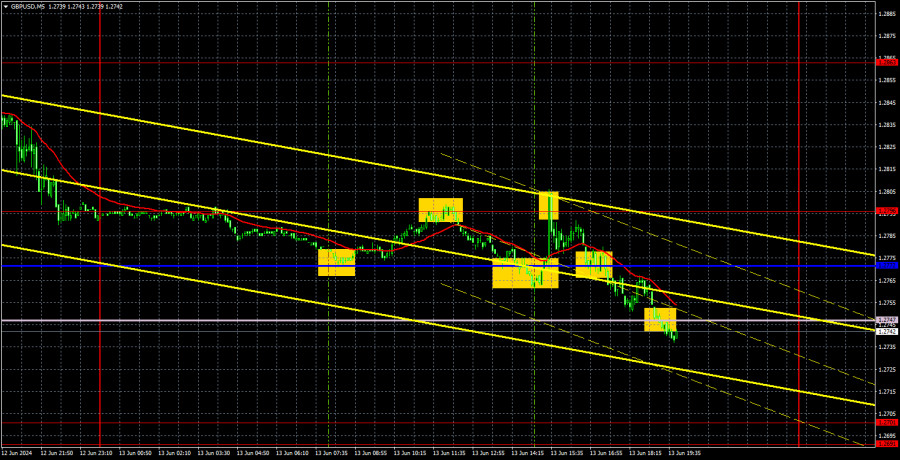
There were quite a few trading signals yesterday, but all of them were between levels and lines. The distance between the Kijun-sen, Senkou Span B, and 1.2796 was about 30 pips, so it made no sense to open trades between them.
COT report:
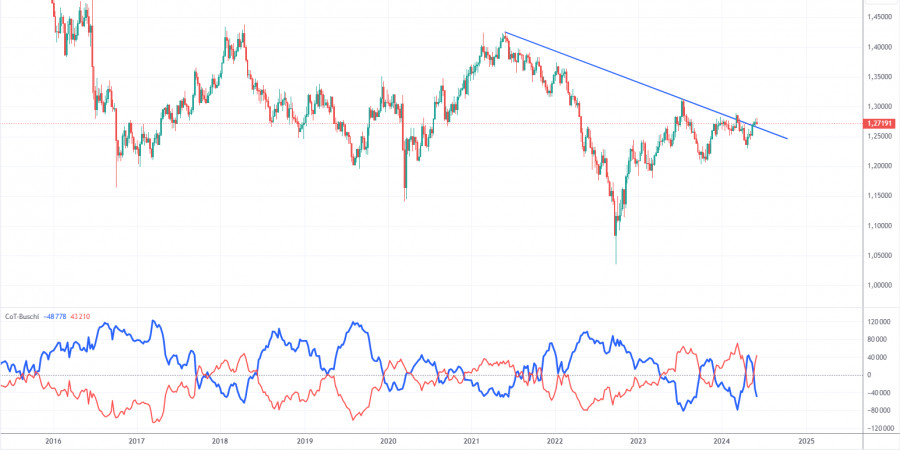
COT reports on the British pound show that the sentiment of commercial traders has frequently changed in recent years. The red and blue lines, which represent the net positions of commercial and non-commercial traders, constantly intersect and generally remain close to the zero mark. According to the latest report on the British pound, the non-commercial group opened 9,000 buy contracts and closed 8,700 short ones. As a result, the net position of non-commercial traders increased by 17,700 contracts over the week, which is quite significant for the pound. Thus, sellers failed to seize the initiative at the most critical moment.
The fundamental background still does not provide a basis for long-term purchases of the pound sterling, and the currency has a good chance to resume the global downward trend. However, the price has already breached the trend line on the 24-hour timeframe at least twice. The level of 1.2765 is currently preventing the pound from rising further, but it has been quite difficult to do so.
The non-commercial group currently has a total of 102,000 buy contracts and 58,900 sell contracts. The bulls have taken the initiative, but aside from the COT reports, there is nothing else that suggests a potential rise in the GBP/USD pair.
Analysis of GBP/USD 1H
On the 1H chart, GBP/USD rose by 110 pips in just a few hours on Wednesday. It seems pointless to discuss the rationale behind such a movement. Clearly, a 0.1% decrease in U.S. inflation is not a substantial reason for such a strong decline. However, we are already accustomed to the market either buying the pound or doing nothing. The dollar managed to slightly recover on Thursday, but it didn't open up prospects for long-term growth. The pair is still trading in a sideways channel, maintaining the potential for a new phase of growth.
As of June 14, we highlight the following important levels: 1.2215, 1.2269, 1.2349, 1.2429-1.2445, 1.2516, 1.2605-1.2620, 1.2691-1.2701, 1.2796, 1.2863, 1.2981-1.2987. The Senkou Span B line (1.2747) and the Kijun-sen line (1.2773) lines can also serve as sources of signals. Don't forget to set a Stop Loss to breakeven if the price has moved in the intended direction by 20 pips. The Ichimoku indicator lines may move during the day, so this should be taken into account when determining trading signals.
On Friday, the UK economic calendar is empty, while the U.S. will publish the University of Michigan consumer sentiment index—a report of secondary importance. It's unlikely that anything will change for the GBP/USD pair, which has been in a flat trend for three weeks.
Description of the chart:
Support and resistance levels are thick red lines near which the trend may end. They do not provide trading signals;
The Kijun-sen and Senkou Span B lines are the lines of the Ichimoku indicator, plotted to the 1H timeframe from the 4H one. They provide trading signals;
Extreme levels are thin red lines from which the price bounced earlier. They provide trading signals;
Yellow lines are trend lines, trend channels, and any other technical patterns;
Indicator 1 on the COT charts is the net position size for each category of traders;


