EUR/USD
Analysis:
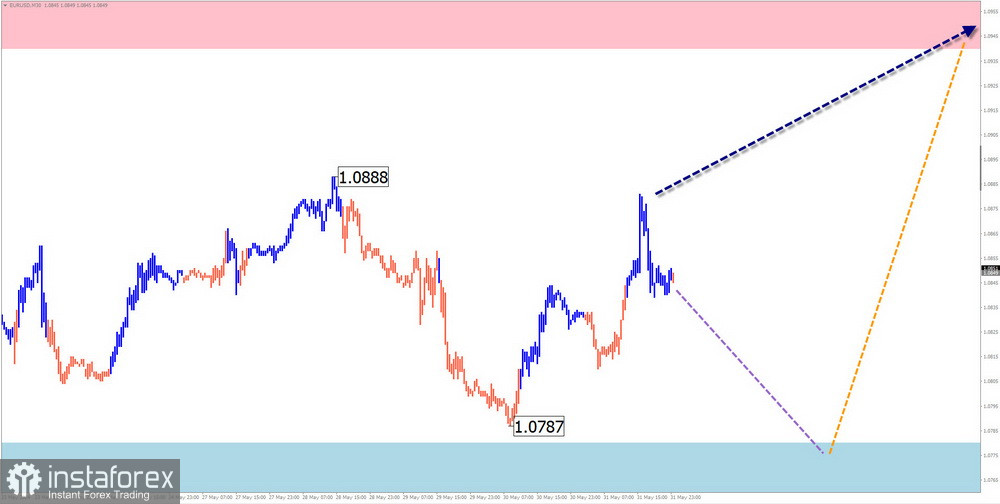
Since mid-last year, the price fluctuations of the euro have been dictated by a descending wave algorithm. The lines drawn at the extremes on the chart show a "horizontal pennant" pattern, which is still incomplete. The upward section from April 16 lacks reversal potential and remains within the current wave model.
Forecast:
The euro is expected to continue its flat trend in the coming days. A brief decline to the support area is possible. After that, conditions for a reversal may form, with an upward price movement most likely by the end of the week.
Potential Reversal Zones
Resistance:
Support:
Recommendations:
Sales: Possible with a reduced lot size within individual sessions, with potential not exceeding the resistance zone.
Purchases: May be considered for trading after reversal signals appear near the resistance zone on your trading system.
USD/JPY
Analysis:
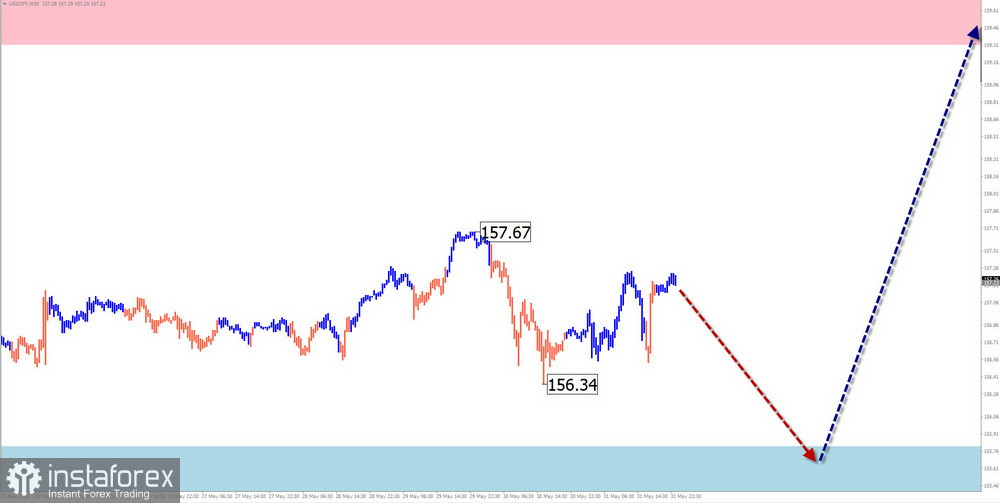
Since December last year, the price fluctuations of the Japanese Yen major have been dictated by a dominant ascending wave algorithm. The last yet incomplete part of the wave structure has been developing since early May. The quotes have formed an intermediate correction within a sideways trend in the past two weeks.
Forecast:
During the upcoming week, a continuation of the sideways price movement of the major is expected, with a potential rise towards the calculated resistance zone. A brief decline is possible in the first few days but within the support boundaries.
Potential Reversal Zones
Resistance:
Support:
Recommendations:
Sales: Have limited potential and are safer with a reduced lot size within individual sessions.
Purchases: May be the main direction for trades in the coming days after reversal signals appear.
GBP/JPY
Analysis:
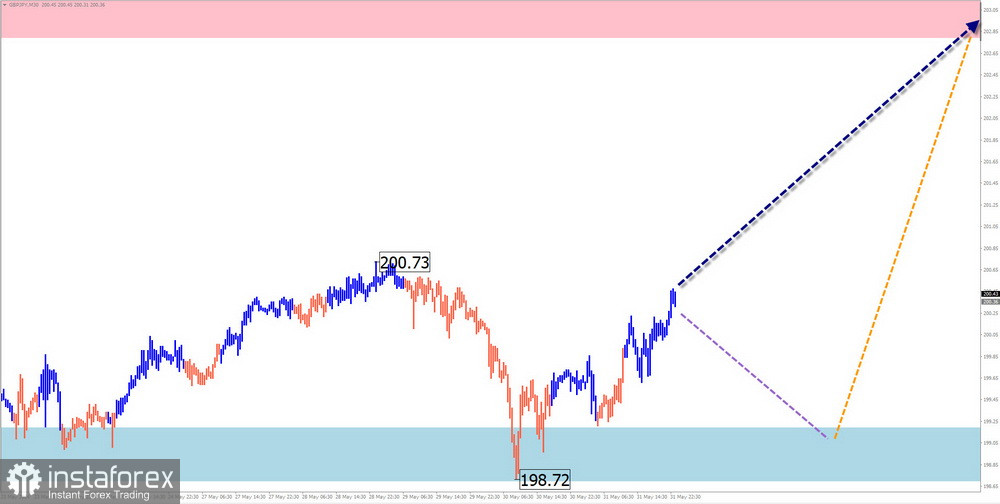
Since early May this year, the direction of the price movement of the GBP/JPY cross has been dictated by an ascending wave algorithm. Quotes have reached the lower boundary of a broad potential reversal zone on the weekly timeframe. The structure analysis shows that it is incomplete.
Forecast:
In the upcoming week, the upward price movement of the cross is expected to continue up to the calculated resistance zone. In the first few days, a price decline remains possible, limited by the support zone.
Potential Reversal Zones
Resistance:
Support:
Recommendations:
Sales: It can be used with a fractional volume size within individual sessions. Support limits its potential.
Purchases: Premature for trading until confirmed reversal signals appear in the support zone.
USD/CAD
Analysis:
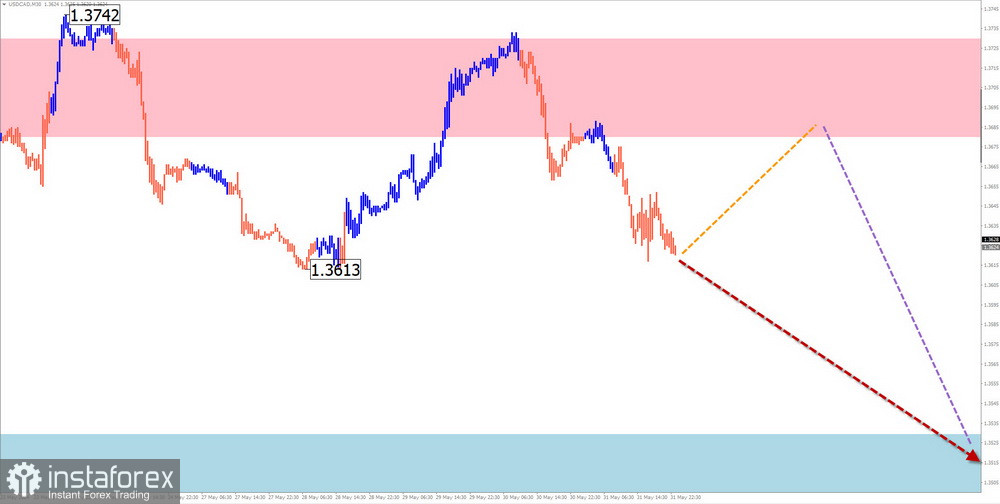
The horizontal pennant formed on the Canadian dollar chart over the last two years is entering its final stage. The current wave structure analysis shows it needs to be completed. The price is near the lower boundary of the potential weekly reversal zone.
Forecast:
In the coming days, the sideways trend along the calculated resistance zone is expected to continue. A brief rebound within the zone is possible, followed by a reversal and renewed decline to the support boundaries. The resistance zone shows the maximum expected upper level of the pair's weekly volatility.
Potential Reversal Zones
Resistance:
Support:
Recommendations:
Purchases: Possible within intraday trades with a fractional lot size, not beyond the calculated resistance.
Sales: This can be considered for trading only after confirmed reversal signals appear near the resistance zone.
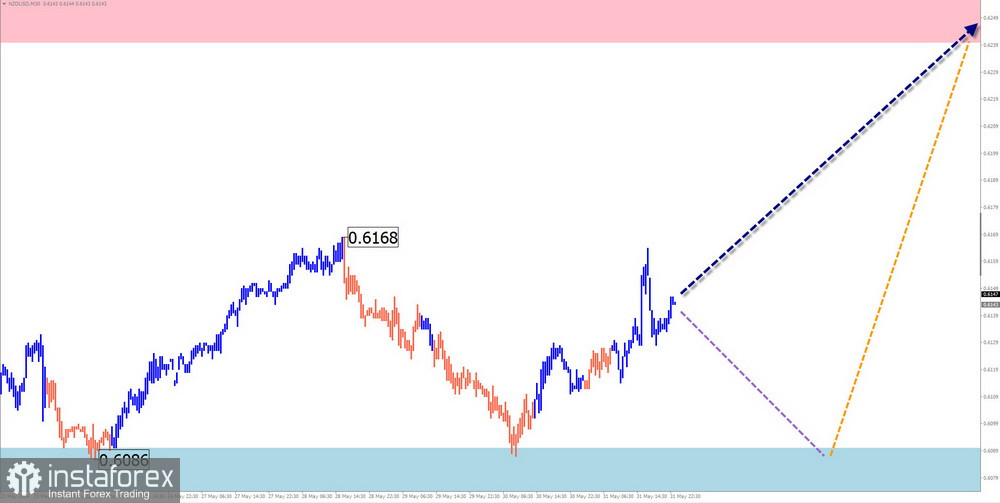
NZD/USD
Brief Analysis:
The New Zealand dollar has been moving sideways within the dominant bearish wave since July last year. The current wave structure still needs to be completed. The bullish segment from April 19 remains within the internal correction.
Weekly Forecast:
The sideways trend is likely to continue for a couple more days, and a brief decline is possible. Before the start of active growth, pressure on the support zone cannot be ruled out. The calculated resistance zone shows the upper boundary of the expected weekly pair movement.
Potential Reversal Zones
Resistance:
Support:
Recommendations
Sales: Have limited potential and may be risky.
Purchases: These can be used in trading after confirmed reversal signals appear near the support zone.
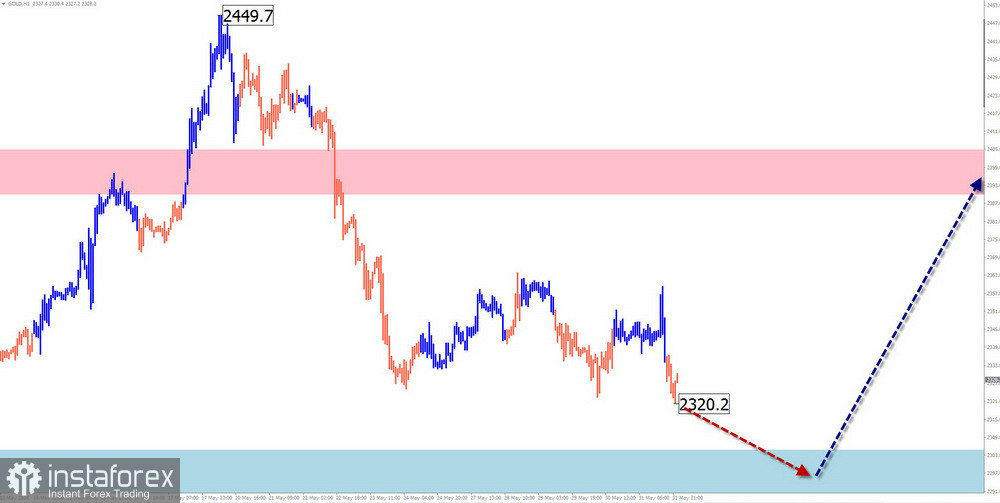
Gold
Analysis:
Gold prices have been moving predominantly sideways since April this year. The forming descending plane is a correction of the previous bullish trend. The structure needs to be completed. The price is at the lower boundary of the sideways corridor formed on the chart over recent months.
Forecast:
The sideways price movement may end in the next few days. Pressure on support is likely initially. Then, a reversal and resumption of price decline can be expected. The highest activity of price fluctuations is anticipated closer to the weekend.
Potential Reversal Zones
Resistance:
Support:
Recommendations:
Sales: Have limited potential and may need to be more profitable.
Purchases: They can be considered the main direction for trades after confirmed reversal signals appear near the support zone on your trading system.
Explanations:
In simplified wave analysis (SWA), all waves consist of 3 parts (A-B-C). The last, incomplete wave, is analyzed for each timeframe. Dotted lines indicate expected movements.
Note: The wave algorithm does not account for the duration of instrument movements over time!